

XAUUSD Predictions: Gold Market Insights
Discover key factors and analysis techniques for XAUUSD trading 🪙. Understand economic impacts and market trends to make smarter gold investment choices 💰.
Edited By
Maxwell Reed
Gold has always been more than just a shiny metal. For centuries, it’s served as a store of value and a go-to safe haven in times of economic uncertainty. When traders talk about XAU/USD, they’re looking at how gold prices move against the US dollar, a key pair in the global markets that often sets the tone for economic sentiment.
Understanding the technical aspects of this pair is not just for the big-shot investors or those sitting in Wall Street offices. Everyday traders and investors alike can benefit by getting a solid grip on what moves gold prices — and how. This article breaks down those essentials, from chart patterns that hint at the next price move, to the indicators that seasoned traders swear by.
Why bother diving deep into XAU/USD? Because gold price movements don’t just reflect metal demand or supply; they also mirror geopolitical shifts, currency fluctuations, and changing economic policies. Getting a hang of the technical analysis tools can turn you from a casual observer into someone who anticipates price swings with more confidence.
In the following sections, we’ll cover major support and resistance levels, popular indicators like Moving Averages and RSI, and how market trends can guide your trading decisions. Plus, you’ll find practical strategies that traders use to manage risk and spot opportunities.
Whether you’re new to trading or sharpening your skills, understanding the mechanics behind XAU/USD price action can give you a leg up in markets that sometimes seem as unpredictable as the weather.
Let’s get started and unravel the layers behind gold’s price dance against the US dollar.
Before diving into the nitty-gritty of technical analysis for gold trading, it's essential to grasp the basics of XAU/USD. This pair represents gold priced in U.S. dollars, and understanding it lays the groundwork for effective trading decisions. Without a solid grip on the fundamentals, you might find yourself lost in a maze of charts and indicators.
Gold behaves differently than typical currencies. Its movements are influenced by factors like global economic health, inflation fears, and geopolitical tensions. Knowing what XAU/USD stands for and why it matters will help you better interpret price swings and market sentiment.
XAU/USD is the ticker symbol used in forex markets to show the price of one troy ounce of gold in U.S. dollars. "XAU" is the international code for one ounce of gold, while "USD" stands for the U.S. dollar. When you look at an XAU/USD quote, you're essentially seeing how much it costs in dollars to buy gold.
For traders, this pair is unique. Unlike currency pairs made from two fiat currencies, XAU/USD pairs a commodity with a currency, making it sensitive to a different set of market forces. Understanding this helps you anticipate how prices might react when, say, the U.S. dollar strengthens or weakens.
Gold isn’t just a shiny metal; it's a key player in global finance. Traders often treat it as a safe haven during economic uncertainty. So, when markets get jittery, demand for gold rises, pushing XAU/USD higher.
Its role as a store of value means gold can sometimes move opposite to the U.S. dollar. For instance, when the dollar drops, gold usually gains as investors seek a safer asset. Recognizing this relationship can give you an edge in predicting XAU/USD price shifts.
Gold has held value for thousands of years, from ancient coins to modern reserves. For centuries, it was the backbone of monetary systems under the gold standard. Although that’s no longer the case, the metal remains symbolic of wealth security.
Its long history gives traders confidence that gold will hold intrinsic value even when currencies falter. This explains why it remains heavily traded in pairs like XAU/USD—it's a bridge between traditional money and tangible assets.
The U.S. dollar’s status as the world’s main reserve currency makes it the natural counterpart for gold. Central banks and financial institutions keep massive dollar reserves, making dollar-related trading pairs the most liquid and widely used.
Because global commodities, including gold, are priced in dollars, any fluctuation in the USD impacts gold prices directly. For example, if the Federal Reserve hints at raising interest rates, the dollar might strengthen, causing gold to dip—this cause and effect is crucial for XAU/USD traders.
Understanding these basics isn't just theory; it directly influences your trading strategy. Knowing what drives XAU/USD helps you react better to market news and technical signals.
By getting comfortable with the nature of XAU/USD and the interplay between gold and the U.S. dollar, you're laying the foundation for solid technical analysis and smarter trade choices.
Understanding what drives gold prices beyond mere charts is essential. Fundamental factors serve as the backbone in shaping XAU/USD movements. They give context to the technical patterns traders see, helping anticipate price shifts with greater confidence.
Gold doesn’t move in isolation — its price reflects inflation whispers, interest rates murmurs, political jitters, and economic waves. By focusing on these elements, traders can avoid blind spots that purely technical approaches might miss. For example, right before the US Federal Reserve hikes interest rates, gold often faces pressure, but when inflation reports spike unexpectedly, gold might rally sharply even if technicals say otherwise.
Grasping these fundamentals offers a practical edge: it allows traders to pair numbers with narratives, improving decision-making when charts and news collide.
Inflation often acts as gold’s alarm bell. When inflation numbers show prices rising faster than expected, gold generally benefits because it’s seen as a store of value. For instance, if Pakistan’s inflation rates suddenly jump due to food price hikes or currency depreciation, locals might flock to gold as a hedge against losing purchasing power.
From a trading perspective, watching Consumer Price Index (CPI) reports or Producer Price Index (PPI) data can hint at future gold trends. Sharp upticks in inflation reports often push gold prices upward, signaling traders to consider long positions or tighten short stops.
Remember, it’s not just the raw numbers but the market’s surprise element that matters. When inflation beats expectations, gold usually reacts more strongly.
Interest rates put a price tag on holding money. When rates climb, gold’s appeal drops since it doesn’t pay dividends or interest. Conversely, rate cuts can fuel gold rallies. For example, when the US Federal Reserve unexpected lowered rates in 2019 due to economic slowdown worries, gold saw a quick price lift.
Traders tracking Federal Reserve statements, Pakistan State Bank’s policy announcements, or global central banks’ moves gain insight on gold’s direction. An unexpected rate hike might prompt quick profit-taking in gold shorts, while dovish tones can trigger buying waves.
In real trading, linking interest rate trends with gold’s technical support levels can improve entry timing.
Gold shines brightest when trouble brews. Political conflicts, wars, or even diplomatic standoffs often push investors towards gold as a safety net. Think of tensions involving Pakistan’s neighbors or unrest in oil-rich regions; such events usually stir up gold demand.
For example, during regional conflicts, gold prices frequently jump as traders reallocate funds from riskier assets like stocks or emerging market currencies to safer gold holdings.
Being aware of geopolitical developments helps traders avoid surprises and capitalize on safe-haven flows.
Unpredictability is gold’s friend. When markets wobble—whether due to economic slowdowns, credit crises, or sudden policy shifts—investors scramble for assets less likely to tank. Gold often tops that list.
Periods like 2008’s financial crisis or the early stages of the COVID-19 pandemic saw gold prices soar, not just due to fundamentals but mass market psychology driving safe-haven demand.
For traders, spotting rising fear or uncertainty indexes alongside gold price action can hint at sustainable rallies.
Tip: Keep a watchful eye on news triggers causing abrupt market moves; these often translate into gold price spikes fueled by safe-haven buying.
In short, fundamental factors—economic data and geopolitical events—act as the wind beneath gold’s wings. Fusing this knowledge with technical analysis equips traders to navigate XAU/USD markets more skillfully.
Technical analysis is the backbone of trading, especially when it comes to XAU/USD, the gold against US dollar pair. Understanding key concepts like trend identification and support and resistance levels helps traders figure out not just where gold prices have been, but where they might head next. This section focuses on core ideas that provide practical edge in reading charts and making smarter trades.
Spotting trends is like getting the pulse of the market. It tells you whether prices are generally climbing or falling over time, which is crucial because trading with the trend usually puts the odds in your favor.
An uptrend is characterized by higher highs and higher lows, indicating persistent buying pressure. For instance, if XAU/USD moves from $1800 to $1850, dips to $1825, then climbs to $1875, it's showing an uptrend pattern. Downtrends work in reverse: lower highs and lower lows, signaling selling momentum. Spotting these patterns early can help you jump on the right side of the trade instead of fighting the market. Pay attention to price swings rather than minor daily moves—trends form over days or weeks, not minutes.
One of the simplest and most effective tools to identify and confirm trends is the moving average, especially the 50-day and 200-day periods. When the short-term 50-day moving average crosses above the longer-term 200-day average, it often suggests a bullish market. Conversely, crossing below might hint at a bearish phase. Moving averages smooth out price noise, helping you see the direction clearly. For gold traders, waiting for price to bounce off the moving average can provide entry points aligned with the trend.
Support and resistance are market’s invisible fences. Knowing where they stand on the gold chart can save you from chasing false breakouts and help set realistic goals.
Support zones are price levels where buying tends to wedge in stronger than selling, stopping the price from falling further. Think of it like a safety net – for example, gold prices might repeatedly bounce back around $1800, marking that as a key support zone. These zones emerge because traders recognize value or bargain prices there, making them natural levels to watch for fresh buys or stop-loss placements.
Resistance points act as ceilings, where selling pressure usually picks up, capping further price gains. For example, if gold struggles to push above $1900 on several attempts, that level acts as resistance. Traders often look for breakouts beyond resistance because it can signal strong buying momentum and a potential new trend. However, false breakouts also happen, so accompanying volume or momentum confirmation is key before committing.
Mastering trend identification alongside support and resistance gives you a double-layered view of the market, creating a sturdy framework to plan trades. It’s like knowing when the tide is rising and where rocks lie beneath the surface.
In summary, these foundational technical aspects are essential for anyone serious about trading XAU/USD. They cut through the volatility noise and show clearer paths for timing entries and managing risks effectively.
Chart patterns play a key role in predicting future price movements in the XAU/USD market. For gold traders, recognizing specific formations on price charts can provide valuable insight into potential continuations or reversals of trends. These patterns act like visual cues, guiding traders on whether to hold their positions, enter new ones, or exit early.
Understanding popular chart patterns is especially useful because gold prices often respond to the psychological plays of many market participants, making these patterns more reliable. By focusing on these shapes and trends, traders can sharpen their timing and reduce emotional decision-making.
Continuation patterns signal that the current trend is likely to keep moving in its existing direction after a brief pause or consolidation. They help traders identify optimal moments to ride the trend further rather than exit prematurely.
Flags and pennants appear after a strong price move, often a sharp rise or fall, and take the shape of a small rectangle (flag) or a small triangle (pennant). These patterns show that the market is taking a breather before continuing in the same direction.
Flags are typically parallel channels sloping against the trend, while pennants look like small symmetrical triangles. For example, if gold shoots up quickly and then starts moving sideways within a narrow channel, this is a flag pattern. Breaking out of this channel on high volume usually confirms the trend's continuation.
Traders can use these patterns to enter new positions or add to existing ones, placing stop losses just outside the flag or pennant range to limit risks. The measured move technique is often applied here, projecting the breakout target by the size of the previous move.
Triangles come in three forms: ascending, descending, and symmetrical. Each has a distinct implication but generally indicates a pause before price moves on.
Ascending triangles have a flat top resistance and rising bottom support, showing strong buying pressure.
Descending triangles have a flat bottom support and lower highs, signaling selling pressure.
Symmetrical triangles feature converging trendlines, implying indecision.
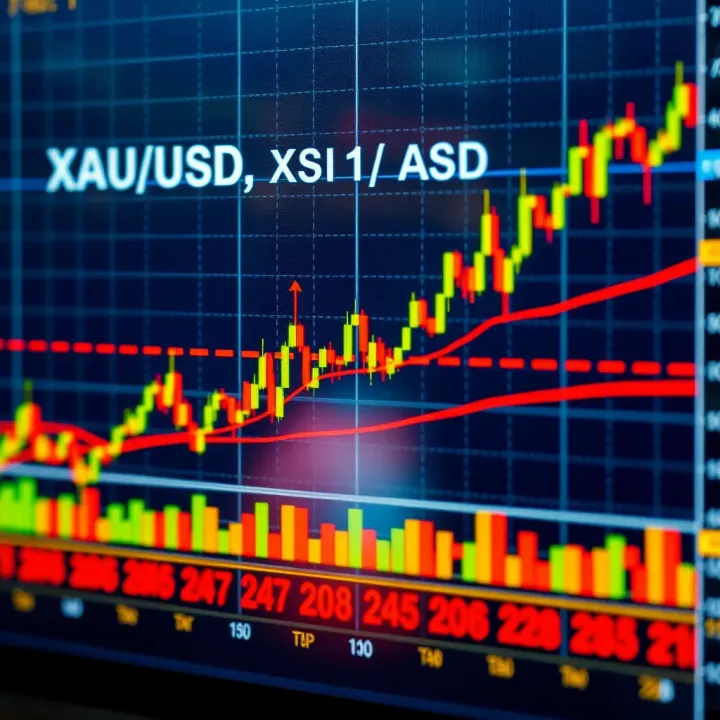
For XAU/USD, spotting a triangle helps traders anticipate breakouts. For instance, a break above an ascending triangle's resistance often leads to a strong upward move, while a break below a descending triangle signals further decline.
Entry points usually occur at the breakout with stop losses placed just outside the opposite side of the triangle. Traders should watch volume during the breakout, as strong volume confirms the pattern’s validity.
Reversal patterns suggest a change in price direction and are essential for traders aiming to catch turning points in the gold market.
The head and shoulders pattern is one of the most reliable reversal signals. It has three peaks: the middle one (the head) being higher than the two shoulders on either side.
In the context of XAU/USD, this pattern often forms after an uptrend, warning that the bullish run may be ending. The price breaks the "neckline" connecting the lows between the shoulders, confirming the reversal.
Traders watch for this break to go short or exit long positions. The pattern’s target is estimated by measuring the distance from the head’s peak to the neckline and projecting it downward from the breakout point.
There’s also an inverse head and shoulders pattern, signaling the end of a downtrend and a potential move upwards.
Double tops and bottoms are straightforward reversal patterns indicating that the price tested a level twice and failed to break through.
A double top forms after an uptrend when price hits resistance twice, separated by a trough. It suggests the bulls are losing strength. Once the support level (neckline) below the trough breaks, a downward move often follows.
Conversely, a double bottom happens after a downtrend, showing strong support as price bounces twice off the same low, signaling buyers stepping in. A breakout above the peak between the bottoms confirms the reversal upwards.
These patterns are quite common in gold trading and give clear entry and exit points. The price target is usually the distance between the peak and trough levels projected from the breakout.
Recognizing these popular chart patterns equips XAU/USD traders with a practical edge. They provide concrete clues about what gold prices might do next and help in planning trades wisely rather than guessing.
By combining these patterns with other technical tools like volume indicators or moving averages, traders can improve confidence in their decisions and better manage risk in the gold market.
When trading gold against the US dollar, using common technical indicators can provide a clearer picture of price movements and potential trends. These indicators help traders filter noise from the market and make more informed decisions. Familiarity with these tools is vital, as gold is influenced by a mix of economic data, geopolitical events, and market sentiment, making pure price observation sometimes misleading.
By combining different indicators, traders can confirm trend strength, predict reversals, and time entries and exits more effectively. For example, moving averages smooth out price action to expose trends, while momentum indicators like RSI help identify overbought or oversold conditions. Meanwhile, volatility indicators reveal how choppy or calm the market currently is, which can guide risk management.
The Simple Moving Average takes the average price over a specific period, like 20 or 50 days, and plots it on the chart. Its straightforward calculation makes it a popular tool for spotting trends. If the price crosses above its SMA, that often signals a developing uptrend; crossing below could hint at a downtrend.
For instance, a trader watching XAU/USD might use the 50-day SMA to decide if gold is gaining momentum. When the price consistently trades above the 50-day SMA, it suggests bullishness. However, the SMA can lag behind quick market moves since it treats all prices equally; hence, sudden shifts might not immediately reflect.
The Exponential Moving Average is similar to the SMA but gives more weight to recent prices, making it react faster to current market conditions. This sensitivity allows traders to catch trend changes sooner. The 20-day EMA is a commonly used one-day version among gold traders.
Say the XAU/USD price jumps sharply due to unexpected inflation data; the EMA will reflect this quicker, providing earlier signals for traders to act on. Many traders like to use the EMA alongside the SMA to cross-check signals – for example, when the 20-day EMA crosses above the 50-day SMA, it can confirm a buy signal.
RSI measures the speed and change of price movements on a scale from 0 to 100, commonly using a 14-day period. Values above 70 suggest the asset is overbought, while values below 30 indicate oversold conditions.
In XAU/USD trading, spotting these extremes can help anticipate pullbacks or reversals. For example, if gold’s RSI hits 75 after a strong rally, it might be time to watch for a price correction. RSI can stay in overbought territories for some time during strong trends, so it’s best combined with other signs.
MACD shows the relationship between two EMAs, typically the 12-day and 26-day. The difference between these averages creates the MACD line, which is compared to a 9-day EMA signal line. Crossovers between these lines provide buy or sell cues.
If the MACD line crosses above the signal line, it often signals gaining bullish momentum in XAU/USD. Conversely, a crossover below the signal line might indicate a selling opportunity. Traders often use MACD histograms to gauge the strength of momentum shifts, which helps in planning entries or exits.
ATR measures the degree of price volatility regardless of direction. In gold trading, it helps in setting stop-loss levels that adapt to current market fluctuations rather than arbitrary fixed points.
For example, during volatile geopolitical events, XAU/USD’s ATR might spike, signaling traders to widen stops and avoid being stopped out prematurely. Conversely, a low ATR indicates quiet markets, where tighter stops might be more appropriate.
Bollinger Bands plot two standard deviations above and below a moving average, usually a 20-day SMA. They expand and contract with volatility, visually framing price action.
When gold prices move close to the upper band, the market might be overbought, hinting at a possible pullback. Moving toward the lower band can signal oversold conditions. Traders often watch for a “squeeze” where bands tighten, anticipating a strong move once volatility returns.
Using a mix of these indicators helps XAU/USD traders get a balanced view. Moving averages for trend, momentum tools to gauge strength, and volatility measures to understand market rhythm all play their part in crafting a winning strategy.
In practice, a trader might spot a buy when the 20-day EMA crosses above the 50-day SMA, RSI is climbing but below 70, MACD confirms positive momentum, and Bollinger Bands show expanding volatility. This layered approach reduces false signals and improves trade timing.
Fibonacci tools are a staple in technical analysis, especially for XAU/USD traders looking to pinpoint precise areas of price action. These tools help illuminate potential support and resistance levels by using ratios derived from the Fibonacci sequence, which often appear in financial markets. For gold traders, this means better timing for trades based on probable pullback or extension levels, rather than guessing blindly.
Unlike some flashy indicators, Fibonacci retracement and extension levels rely on simple math and past price behavior. This practical approach is particularly useful in gold trading due to gold's tendency to exhibit clear wave-like movements during trends and corrections. Applying these tools lets traders identify critical retracement points where the price might reverse or pause, and project future price targets, enhancing decision-making.
Fibonacci retracement levels are marked at percentages like 23.6%, 38.2%, 50%, 61.8%, and 78.6%, calculated between a recent significant high and low. These levels represent where gold’s price often pulls back before continuing in its original direction. For example, after a strong upward move from $1780 to $1850, a retracement level at 38.2% might signal a pullback zone near $1815, where buyers could step back in.
Recognizing these levels helps traders distinguish between healthy corrections and possible trend reversals. It’s worth noting that the 61.8% level, often called the “golden ratio,” carries real significance in forecasting. When gold stalls or bounces around this zone, it’s often a good hint of underlying market sentiment.
Practical use of Fibonacci retracements is about timing and risk management. Traders commonly look to enter on a pullback near a retracement line, setting stop losses just beyond the next level to minimize losses in case of a breakdown. For instance, if gold price pulls back to the 50% retracement around $1815 during an uptrend, entering a buy at this level with a stop loss slightly below the 61.8% retracement could limit downside risk.
On the exit side, retracements also guide when traders should consider locking in profits during counter-trend moves. By coupling retracement analysis with other technical indicators like RSI or MACD, traders get a clearer signal on when a retracement might end and the trend is ready to resume.
Once a retracement completes and the original trend resumes, Fibonacci extensions come into play to project where the price could head next. Common extension ratios include 127.2%, 161.8%, and 261.8%. These levels serve as potential resistance or profit-taking points in an uptrend, or support in a downtrend.
Imagine gold breaks out from a retracement near $1820 and starts climbing. Traders might use the 161.8% extension from the last low to mark a price target around $1870 for taking profits. These extensions are especially handy because they quantify a target based on prior moves, rather than arbitrary guesses.
Effective profit-taking is a challenge for many traders, and Fibonacci extensions provide a systematic way to do this. By setting profit targets at extension levels, traders capture gains at realistic turning points instead of holding on for too long or exiting prematurely.
For example, if a trade was entered near the 38.2% retracement and the trend picks up steam, setting a take-profit near the 127.2% or 161.8% extension offers a balanced approach between risk and reward. Combining this tactic with trailing stops can optimize returns while protecting against unexpected reversals.
Using Fibonacci retracements and extensions together makes for a powerful toolkit in gold trading. They provide clear visual cues for entries, exits, and profit targets that align with how markets often behave, giving traders an edge over pure guesswork.
To sum up, mastering Fibonacci tools allows gold traders to make informed, calculated moves rather than shooting in the dark. These retracement and extension levels reveal where price might stall, turn, or run, helping improve trade timing and overall strategy effectiveness.
Volume often flies under the radar when traders focus solely on price action, yet it’s a powerful ally in understanding market dynamics—especially for XAU/USD. At its core, volume measures the number of trades or contracts executed within a time frame, revealing how much interest or conviction there is behind price moves. Without volume, price alone might lead you astray, like trying to read a play's finale without knowing the crowd's reaction.
In gold trading, watching volume helps determine whether a price rally or drop is backed by solid market participation or if it’s just a fluke move. For example, if gold prices jump but volume is weak, it could indicate hesitation—traders aren’t fully buying in, hinting the move might falter soon. On the other hand, if volume surges as prices rise, it confirms strong momentum and trader confidence, suggesting the trend could sustain or accelerate.
Volume serves as a confirmation tool for trends in XAU/USD prices. A classic sign of a strong uptrend is rising prices paired with increasing volume, showing more traders are jumping on the move. Conversely, declining volume during price advances might warn of a weakening trend. Imagine gold prices climbing steadily but volume fading; this could foreshadow exhaustion as fewer traders are willing to buy at higher levels. This dynamic helps traders decide when to ride the wave or tighten stop losses.
For example, during the 2020 gold rally, spikes in volume often coincided with key price breakouts above resistance, signaling real buying pressure. Paying attention to volume thus prevents blind entry based on price alone, helping traders avoid traps.
Shifts in volume patterns can also alert traders to possible turning points. A sudden surge in volume near a support or resistance level often indicates battle between bulls and bears. If a downtrend is accompanied by rising volume on a bounce, it might signal buyers stepping in, preparing for a reversal. On the flip side, heavy volume on a price drop after a long rally might hint sellers gaining control.
Think of volume spikes as a crowd’s roar at a game’s turning moment. Traders watching volume can catch fizzles and flips before they become obvious in price alone, gaining an edge in timing.
OBV is a straightforward yet effective indicator that accumulates volume based on price direction—adding volume on up days and subtracting on down days. It helps spot divergences and gauge whether volume supports current price moves. For instance, if gold prices hit new highs but OBV fails to climb correspondingly, it’s a red flag for weakening momentum.
OBV is practical because it’s easy to interpret and fits well with other tools. Traders can monitor OBV trends alongside XAU/USD charts to confirm if volume backs the trend or warns of weakening strength.
VWAP gives a more detailed average price weighted by volume throughout the trading day. It reflects the average price traders have actually paid and serves as a benchmark for evaluating market sentiment.
For intraday gold traders, VWAP is invaluable. Trading above VWAP suggests buyers dominate, while prices below VWAP may show selling pressure. For example, if gold price slices through VWAP with heavy volume, it could be a sign of a strong breakout worth watching.
Using VWAP alongside volume helps in setting meaningful entry points and stops. It’s especially handy during volatile news events where price spikes can mislead.
In essence, volume adds the context price needs to tell a fuller story. For XAU/USD traders, tuning into volume patterns and using indicators like OBV and VWAP can sharpen entries, confirm trends, and warn of reversals, making their trading far better informed.
Timing is everything in gold trading, especially when you’re working with XAU/USD. Candlestick patterns are a reliable tool that helps traders spot potential price reversals or continuations right when they happen. Instead of guessing, these patterns give clearer signals for entering or exiting trades, which can really keep losses in check and lock in profits.
The beauty of candlestick patterns lies in their simplicity and the story they tell about market sentiment. For instance, if you notice a certain candlestick shape forming after a long downtrend, it could hint at buyers stepping in and a possible price bounce. But if traders ignore these signs or jump in too early, they risk chasing false moves. So, recognizing and interpreting these candlestick signals properly can make a noticeable difference in your trading outcomes.
The hammer and morning star patterns are like green flags for potential price turns upwards. A hammer usually shows up after prices drop, with a small body and a long lower wick, suggesting that sellers pushed prices down but buyers fought back strongly by the close. It hints that the downward pressure might be easing.
Similarly, the morning star is a three-candle pattern signaling a trend reversal from bearish to bullish. The middle candle typically has a small body—sometimes a doji—indicating indecision, with the last candle closing well above the first, showing buyer strength. Traders often see this pattern as a reliable entry point for buying gold because it flips the narrative from sellers dominating to buyers gaining control.
Bullish engulfing patterns jump out when a small bearish candle is immediately followed by a bigger bullish candle that fully "engulfs" the previous one. This suggests a strong shift in momentum, where buyers overpower sellers suddenly. For XAU/USD, this pattern is especially helpful after a downtrend, indicating a possible upward rally.
When you see this pattern during gold trading, it’s often a sign to prepare for a price push higher. The key is confirmation—like a close above the high of the engulfing candle—before pulling the trigger on a buy order. This cautious approach helps avoid traps where the momentum fizzles out right after.
On the flip side, the shooting star and evening star patterns are giveaways for possible price dips ahead. The shooting star has a small real body near the bottom of the range with a long upper wick, signaling that buyers tried to push prices higher but were quickly overwhelmed by sellers. It's a hint the uptrend may be losing steam.
The evening star is similar to the morning star but reversed—it’s a bearish reversal pattern consisting of three candles: a big bullish candle, followed by a small-bodied candle that shows indecision, then a strong bearish candle that closes well into the gains of the first candle. This shift suggests sellers are taking back control, useful for those wanting to short gold or secure gains.
Traders watch these patterns for signs to either exit long positions or to consider short setups. Like bullish patterns, waiting for confirmation such as a break below the evening star’s low can improve timing and reduce risks.
Finally, the bearish engulfing pattern is a clear red flag that sellers took over. It happens when a small bullish candle is followed by a larger bearish candle that completely swallows the previous gain. This shows a major sentiment flip to the downside, usually signaling that gold's price might drop further.
In practice, spotting a bearish engulfing candle after an uptrend in XAU/USD encourages traders to tighten stops or take short positions. Confirmation might involve waiting for the price to fall below the engulfing candle’s body, ensuring the momentum isn't a one-off spike.
Remember: Candlestick patterns work best when combined with other analysis tools like volume or moving averages. Sticking to this can greatly improve your trade timing and decision-making.
Managing risk in gold trading is not just a suggestion, it’s a must if you want to hang around in the game for the long haul. Gold’s price can swing wildly – it’s influenced by everything from geopolitical news to sudden shifts in the dollar. Without a solid plan to manage these ups and downs, even a few bad trades could wipe out your gains.
Risk management lets traders keep control instead of getting tossed around by market swings. This means setting limits on losses and deciding how much of your capital to put on each trade. The payoff? You stay in the game, avoid emotional trading, and slowly build your strategy on firm ground.
Choosing logical price points is where a lot of traders trip up. It’s tempting to slap on a stop loss anywhere just to limit losses, but where you place it should make sense based on the market action. A good stop loss might sit just below a recent support level or after a key Fibonacci retracement, protecting you if the price moves against you while avoiding being stopped out by normal fluctuations.
Take profit works the same way. It’s about locking in gains at levels where the price has shown resistance or where technical indicators suggest a reversal. For example, if gold has regularly bounced back from $1,950 an ounce, setting your take profit just below that might be smart. This approach helps keep your trades aligned with market behavior, instead of reacting to emotions.
Adjusting stops with volatility is another smart move to prevent getting kicked out of a trade too early. When gold is volatile, price can jump around a lot. If your stop loss is too tight, you’ll get stopped out frequently, even if the overall trade idea is still valid. Traders often use tools like the Average True Range (ATR) to set stops relative to recent market moves. For example, if ATR shows gold typically swings $15 in a day, setting your stop nearer to $20 or $25 away from entry might give you more breathing room.
Managing stops dynamically helps you keep trades alive through the noise, but still protects your account from big losses.
Calculating risk per trade starts with knowing how much of your account you’re willing to lose on a single trade. Many traders cap this risk at 1-2% of their total capital. For instance, if you have $10,000, risking $100 to $200 per trade keeps blowups manageable. From there, you figure out position size based on how wide your stop loss is. If your stop loss is $10 away from your entry price, you’d buy enough gold contracts so that a $10 move equals a $100 loss.
This method takes the guesswork out of position sizing and keeps losses predictable.
Using fixed lot sizes versus percentage methods is a choice that reflects your trading style and discipline. Fixed lot sizing means you trade the same amount every time – it’s simple, but risky since a wider stop loss one day could mean higher losses.
Percent-based methods adjust position size based on where your stop loss sits. This means if volatility spikes and your stop loss gets wider, you trade fewer contracts to keep risk steady. While percent-based sizing is more complex, it aligns risk more closely with market conditions and protects your account more effectively.
A practical example: if gold’s volatility doubles and your stop loss grows from $10 to $20, with a fixed lot size you risk double the amount. With percentage sizing, you’d cut your position in half to keep risking the same dollar amount.
Position sizing isn't just about math; it’s your frontline defense against letting a single trade derail your whole portfolio.
Getting risk management right for gold trading takes patience and practice. But by choosing logical stops, adjusting for shifts in volatility, and sizing positions based on risk, you build a strong safety net. This frees you to focus on analyzing price action and spotting opportunities without letting fear or greed run the show.
Trading gold against the US dollar can be rewarding, but it's also easy to slip up if you overlook some common pitfalls. Understanding and avoiding these mistakes helps in making better decisions and reduces the chances of unnecessary losses. Whether you're a beginner or a seasoned trader, recognizing these errors sharpens your analysis and trading skills.
One common trap in XAU/USD technical analysis is leaning too heavily on just one indicator. While it might feel comforting to trust a familiar tool, gold prices rarely behave predictably enough for that to work consistently.
Importance of combining tools: No single indicator tells the whole story. For example, using the RSI alone might signal overbought conditions, but that doesn't guarantee a reversal. Pairing RSI with a moving average crossover or volume indicators can confirm whether the trend is genuinely weakening or if it's a false alarm.
Avoiding false signals: Indicators can frequently give misleading signals, especially in choppy or sideways markets. If you rely only on MACD without considering support and resistance zones, you might enter a trade right before a sharp reversal. Combining various technical tools reduces the risk of acting on fake moves and helps validate your trading decisions.
Gold doesn't move in a vacuum. Changes in economies, politics, and other markets have a tangible effect on XAU/USD, so ignoring those factors can lead to costly mistakes.
Considering economic news: Important releases like the US Non-Farm Payrolls, inflation numbers, or interest rate announcements often trigger sudden gold price moves. Ignoring these events or failing to grasp their context means you might miss the big picture or get caught on the wrong side of a trade. Traders need to stay alert to scheduled economic events and understand how they impact gold.
Watching related markets: Since gold is often seen as a safe haven, it tends to react opposite to riskier assets like stocks or currencies. For instance, a spike in the US dollar index or stock market crashes can push gold prices up as investors seek safety. Watching these related markets can provide early clues and help you anticipate shifts in gold trading instead of reacting too late.
Avoiding these mistakes isn't about being perfect but about improving your awareness and adaptability in gold trading. Mixing indicators wisely and keeping an eye on the wider market turns guesswork into informed decisions.
Remember, trading gold successfully means combining solid technical analysis with a good grasp of economic realities. This balanced approach gives you an edge over those who ignore the broader picture or rely on a single tool alone.
Building a solid trading plan is a must for anyone serious about trading XAU/USD. Gold’s price swings can be wild, and jumping in without a plan is like sailing in a storm without a compass. A good plan doesn't just outline when to trade; it lays down the rules for managing risk, setting targets, and handling emotional ups and downs. This section breaks down how to craft a plan that fits gold trading’s unique quirks and helps you stay disciplined.
Technical signals are the bread and butter of entering and exiting trades in gold markets. For instance, if you notice RSI dropping below 30, it might suggest the gold price is oversold, providing a potential buy signal. Conversely, a crossover of the MACD below its signal line could hint at a sell opportunity. These signals act like traffic lights—telling you when to slow down or speed up in your trading. Integrating multiple signals, such as combining Fibonacci retracements with candlestick patterns, sharpen the chances of picking timely entry and exit points. This systematic approach helps avoid emotional decisions and keeps trades aligned with market momentum.
Having clear, written rules for when to pull the trigger or close a position is what separates casual guesswork from professional trading. For example, a rule might be: "Enter a trade only when the 50-day SMA crosses above the 200-day SMA and RSI is above 50". On the exit side, you could set a stop loss at 2% below your entry price to limit potential losses, while take profit might be set at a previous resistance level. Clear rules reduce guesswork and prevent jumping ship too early or holding on too long. They also make it easier to review trades afterward and learn from mistakes.
Before putting real money on the line, testing your strategy against past gold price data is smart. Backtesting lets you see how your set of trading rules would have performed during different market conditions, like the 2011 gold spike or the dip during 2013. Tools like MetaTrader or TradingView offer historical charts and simulation features to run your strategy without risk. This process reveals the strengths of your approach but also highlights weak spots that might not be obvious in live trading.
Backtesting is only the first step; refining the strategy based on results is crucial. Say your approach shows good wins but also some heavy losses during certain volatile periods. You might tweak stop losses, adjust position sizing, or add filters like volume confirmation to tease out better signals. Continuous refinement, guided by data, keeps your plan resilient. Over time, tweaks should help your strategy handle gold’s unpredictable moves better and improve overall performance.
Remember, a trading plan is a living document—not something you write once and forget. Stay flexible, honest with your results, and ready to adapt as markets change.
This practical blueprint ensures traders have a clear roadmap when navigating XAU/USD, helping to turn gold trading from a shot in the dark into a measured, informed endeavor.
Wrapping up this guide, it’s clear that understanding XAU/USD technical analysis isn’t just about spotting charts and crunching numbers; it’s about combining tools, knowing when to adapt, and keeping an eye on the bigger picture. These practical tips help traders avoid common traps and make more informed decisions.
For example, traders who ignore volume in their analysis might miss crucial confirmation signals, ending up on the wrong side of a price move. Similarly, failing to adjust stop-loss orders according to market volatility can quickly wipe out gains when the gold price suddenly swings. So the takeaway? Stay flexible, rely on a mix of indicators, and always look beyond just technical charts.
Continuous learning and adaptation are key in the gold market’s ever-changing terrain. What worked last year might not hold up today, especially with external forces like geopolitical shifts or changes in US monetary policy affecting gold prices. For instance, a trader who sticks rigidly to a single moving average might miss emerging patterns like a sudden shift from a bullish to a bearish trend. By regularly reviewing your strategies and studying recent price action, you stay ahead of the curve.
Practical ways to do this include keeping a trading journal, where you note down why you entered or exited trades, and reviewing these after a few weeks to spot mistakes or biases. Also, participating in trading forums or attending webinars can expose you to fresh viewpoints, vital when gold prices act unexpectedly.
Integration with fundamental analysis strengthens your trading decisions. Technical setups often look perfect, but without considering factors like interest rate hikes or inflation data, your trades might face headwinds. For example, if inflation jumps but your chart indicates a gold sell signal, integrating both views might suggest holding off or adjusting position size.
Simply put, fundamentals provide the “why” behind price moves, while technicals give you the “when.” A balanced approach might mean using economic calendars to time your technical entries, avoiding major news releases that cause erratic spikes in gold prices.
Discover key factors and analysis techniques for XAUUSD trading 🪙. Understand economic impacts and market trends to make smarter gold investment choices 💰.
📊 Explore today's XAUUSD analysis: gold price trends, key economic factors, geopolitical impacts, and smart trading insights for Pakistan investors.

📈 Get expert insights on XAU/USD forecasting! Understand gold price moves against the US dollar with economic data, geopolitics, and market trends.

📈 Explore key factors shaping gold prices in Pakistan—economic trends, global markets, and policies—to plan smarter investments and trading moves ahead.
Based on 7 reviews