
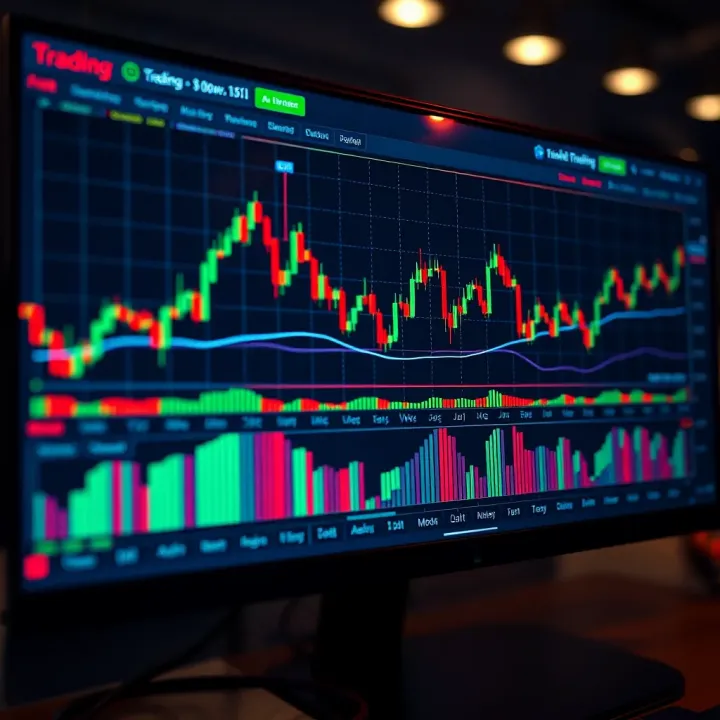
Using TradingView.com for Market Analysis: A Practical Guide
📊 Discover how to use TradingView.com for efficient market analysis with real-time data, charts, and tips tailored for traders in Pakistan.
Edited By
Edward Thompson
TradingView has rapidly become a go-to platform for traders and investors, especially in Pakistan where access to real-time market data and community insights is vital. Whether you're a day trader tracking volatile stocks or a long-term investor watching forex or commodities, TradingView offers versatile tools tailored for every style.
This guide aims to walk you through everything TradingView offers — from setting up your charts, choosing indicators, to engaging with its active social community. You'll learn how to use the platform to make smarter, data-driven decisions without getting bogged down by jargon or technical hurdles.
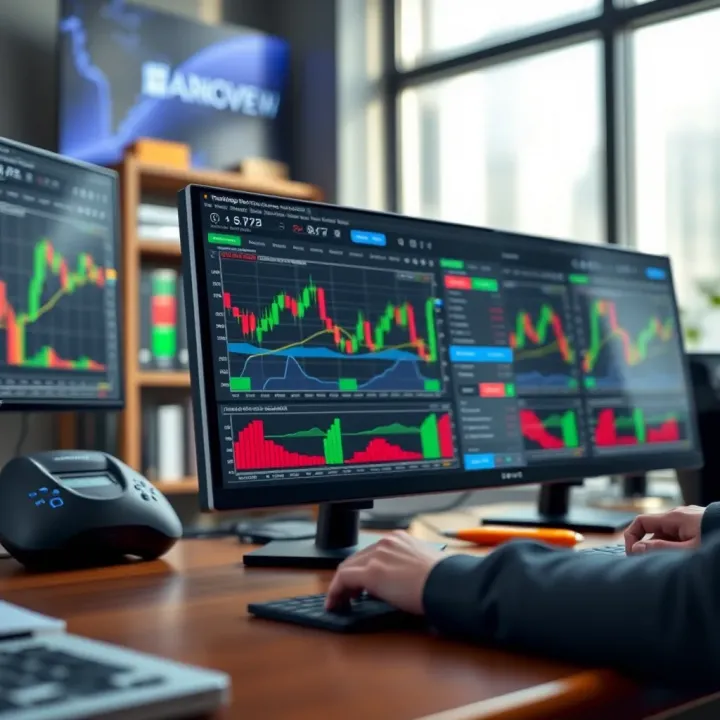
Understanding these features is no longer a luxury; it's a necessity. In local markets where quick shifts can mean the difference between profit and loss, knowing how to efficiently analyze market trends via TradingView can give you a clear advantage. Whether you’re an analyst looking to deepen your technical toolkit or a broker serving clients with timely insights, the following sections will equip you with the know-how to make the most of this versatile tool.
Getting familiar with TradingView's interface and capabilities isn't just about fancy charts—it’s about empowering yourself to read market shifts confidently and act upon them with clarity. Let’s get cracking on that.
TradingView has become a go-to platform for many who trade or analyze markets in Pakistan and beyond. The core value lies in its rich set of tools that fit a wide range of experience levels—from beginners to seasoned pros. Whether you're watching the Karachi Stock Exchange or tracking global forex pairs, TradingView offers a fast, reliable way to visualize market data. This section walks you through why TradingView matters in practical trading decisions and how it fits into everyday analysis.
At its heart, TradingView is an online charting and analysis platform. It pulls real-time market data into dynamic charts, allowing users to spot trends, annotate moves, and apply technical indicators with ease. More than just charts, it gives you a bird’s-eye view of multiple markets—stocks, forex, crypto, commodities, and more—all in one place. The main goal is pretty straightforward: to help traders make smarter decisions without needing several software tools cluttering their desktops.
For example, a day trader in Lahore can quickly check how the US Dollar is performing against the Pakistani Rupee while simultaneously analyzing the stock charts of Pakistan Petroleum Limited. This integrated approach saves time and avoids missing key information.
TradingView's user base ranges from individual traders and financial advisors to educators and institutional analysts. In Pakistan, retail traders especially like its user-friendly interface and the flexibility it gives for customizing studies and indicators.
Some users mainly seek clear visuals for spotting entry and exit points, while others dive deep into scripting custom indicators through TradingView’s Pine Script. Its social features—where traders share ideas and strategies—also draw in users hungry to learn from the community.
The platform's diversity in users ensures features cater to different needs, from simple chart reading to complex algorithm development.
Pakistan’s traders often face challenges in accessing reliable, affordable charting tools. TradingView’s online nature means no hefty software installations are needed, and it works well even with moderate internet speeds common in many parts of the country. Plus, its pricing plans include a solid free tier that lets beginners test the waters without financial risk.
Moreover, TradingView’s platform supports Urdu and English, making it easier for a wider range of users. This local relevance lowers the barrier for non-English speakers or new traders growing their skills.
One standout is TradingView's inclusion of regional market data. It covers major Pakistani exchanges like the PSX (Pakistan Stock Exchange) with live prices and accurate data feeds. This is something many international platforms omit, forcing traders to rely on slower or less reliable local sources.
Having local instruments directly available simplifies tracking and comparing market movements without switching platforms or recalculating values.
In short, TradingView provides Pakistan’s traders a practical, accessible way to analyze both local and international markets. This sets the scene for deeper dives into its features covered in upcoming sections.
Jumping into TradingView can feel a bit overwhelming at first, especially if you're new to market analysis tools. But setting it up rightly from the start clears the path for smooth trading and smarter analysis. This section lays out how to create your account, choose the plan that fits your needs, and get familiar with the platform’s layout so you can navigate it confidently.
TradingView offers a decent free version that’s enough for casual traders or beginners exploring the market. It lets you access basic charts, a handful of indicators, and watchlists but restricts you to one chart per layout and a limited number of alerts. For instance, if you're just tracking Pakistan Stock Exchange (PSX) indices or major Forex pairs, the free plan might suffice.
On the other hand, the paid plans, like Pro, Pro+, or Premium, unlock more sophisticated features for serious traders. These plans provide multiple charts in one layout, more alert allowances, ad-free experience, and access to more indicators and extended historical data. Suppose you trade frequently or run complex strategies, upgrading makes sense to avoid the frustrations of limited setups.
Creating an account is straightforward. Just click on the sign-up button, provide an email or use a social media login like Google or Facebook, and pick a username. After confirming your email, you’re ready to roll. The intuitive onboarding walks you through basic settings, like selecting your preferred market regions—which can be super helpful for traders focused on local assets, such as the Pakistan rupee futures or the Karachi KSE-100 index.
Tip: Take a moment during setup to set your time zone correctly, especially if you trade market hours specific to Pakistan or nearby regions. It saves you from missing critical trade windows!
TradingView’s interface is designed to be approachable yet powerful. The core of the screen is the chart window where all price action, indicators, and drawing tools live. To the left, you’ll spot the commonly used drawing toolbox—to sketch support lines or draw Fibonacci levels. On the right, the watchlist and alerts keep you informed at a glance.
The bottom area often holds order history or news feeds, depending on your setup. This modular layout means you get everything needed for market analysis without clutter but still can customize what you see.
At the top, the main menu offers tabs for key functions. You’ll find the symbol search to quickly jump to different stocks, forex pairs, or cryptocurrencies. Next to it are timeframes (1-minute, 5-minute, daily, weekly, etc.) letting you zoom in or out on the market picture.
Toolbars provide quick access to indicators like RSI or MACD and options to save custom layouts or set alerts. For example, clicking the beacon icon lets you set up price alerts that notify you via email or SMS—a handy feature to stay on top of the PSX’s morning volatility without glued eyes on the screen.
Getting at least a basic handle on these controls early makes your workflow smoother and avoids any last-minute scramble during fast-moving market conditions.
Setting up TradingView properly and knowing your way around the platform's controls is like knowing the layout of a new city before heading out. It gives you confidence, speeds up your work, and makes trading less stressful. Next up, we’ll dig into charting basics, where the real fun of analyzing market trends begins.
Understanding the basics of charting on TradingView is essential for anyone serious about market analysis. Charts are the foundation upon which traders base their decisions. With the right chart types and custom settings, you can spot price patterns and trends that others might miss. Whether you're tracking the Pakistan Stock Exchange or the USD/PKR forex pair, the way you view data can make a big difference to your strategy.
Candlestick: Candlestick charts are probably the go-to type for most traders. They show open, high, low, and close prices all in one. Each candle’s body tells a story — a long green candle indicates strong buying, while a long red one signals selling pressure. For instance, if you see a hammer pattern forming during a downtrend, it might hint at a reversal. In TradingView, candlesticks provide a quick visual grasp of market sentiment.
Line: Line charts connect closing prices with a simple line, making them less cluttered than candlesticks. These are useful if you're looking for a broad-picture trend without getting bogged down by daily price swings. Imagine checking the long-term trend of the KSE 100 Index — a line chart gives clarity by smoothing out noise, helping traders identify clear support or resistance levels.
Bar: Bar charts display the same data as candlesticks but in a slightly different style, with vertical bars showing the price range for each period. They allow traders to focus more on the high and low points rather than the candle's body. If you want to emphasize volatility and price extremes, bar charts can be insightful.
Heikin Ashi: Heikin Ashi charts are a twist on candlesticks, designed to smooth out price action by averaging values. This helps filter out market noise. Traders often use Heikin Ashi during trending markets to stay in trades longer, as it makes trends appear more clearly. For example, during fluctuating forex pairs like USD/PKR, Heikin Ashi can help avoid premature exits caused by minor pullbacks.
Color themes: TradingView lets you pick colors that suit your eyes and style. Some prefer dark themes to ease eye strain during long sessions, while others might choose bright themes for clarity. The right color setup helps you focus better and cuts down mistakes, especially when scanning multiple charts.
Grid settings: Grids can either be a huge help or a distraction. Opting to show grid lines makes it easier to measure price levels and identify patterns, but too many lines might clutter your view. Adjust grid density based on your preference; for day trading, a tighter grid helps with precision, whereas swing traders might keep it relaxed.
Timeframes: Choosing the correct timeframe is crucial. A 15-minute chart is suited for intraday trades, while daily or weekly charts fit long-term investors. TradingView offers a wide range of options, letting you toggle between them effortlessly. For example, a trader tracking oil prices might watch daily charts for trend direction, but zoom into hourly charts when planning entry points.
Getting your charts set up the way you like isn’t just about aesthetics — it’s about making your analysis sharper and more efficient. Keep tweaking your settings based on your trading style, and you’ll find yourself spotting opportunities faster.
By mastering these basics, you’ll lay a solid groundwork for deeper technical analysis using the more advanced features of TradingView. Charting isn't just looking at numbers; it's about telling the story behind those numbers, and TradingView gives you all the tools to do just that.
Technical analysis on TradingView hinges heavily on the use of indicators and drawing tools. These features help traders decode price movements and market trends, enhancing their decision-making skills. Without these tools, analyzing the market can feel like shooting arrows in the dark. In this section, we'll break down some of the most popular indicators and essential drawing tools available on TradingView, illustrating how these can be applied for better insights and effective trade execution.
Indicators give traders a statistical edge by highlighting patterns or signals within price data. TradingView offers a range of built-in indicators, but some stand out for their usefulness and simplicity.
Moving averages smooth out price data to form a trend-following indicator. The simple moving average (SMA) and exponential moving average (EMA) are most common. For example, a 50-day SMA tracks the average closing price over the last 50 days, helping traders spot the general direction of the market. When prices cross above the SMA, it can signal a potential uptrend; crossing below might indicate a downtrend. Moving averages are straightforward but powerful, great for beginners to gauge momentum or confirm other signals.
RSI measures the speed and change of price movements to spot overbought or oversold conditions in a market. Typically calculated over 14 periods, an RSI above 70 suggests the asset may be overbought and due for a pullback, while below 30 often signals oversold conditions that could lead to a bounce. For instance, if a Pakistani equity’s RSI shoots above 70, it might be prudent to wait before entering new long positions, watching for a pullback.
The MACD is a trend-following momentum indicator calculated by subtracting the 26-period EMA from the 12-period EMA. It also includes a signal line (usually a 9-period EMA) that helps identify buy or sell signals. When the MACD line crosses above the signal line, it’s a bullish sign; crossing below, bearish. An example would be spotting a bullish MACD crossover for a Forex pair like USD/PKR, indicating strength and potential buy opportunities.
Bollinger Bands consist of a middle band (usually a 20-period SMA) surrounded by an upper and lower band set two standard deviations away. These bands expand and contract based on volatility. When price touches or moves outside the bands, it’s often a sign the market is overextended. For instance, if a commodity’s price on TradingView moves above the upper band, it could signal a potential reversal or upcoming consolidation.
Drawing tools are fundamental for marking key levels and patterns directly on charts. These tools help traders visualize trends and important price zones.
Simple but effective, trend lines connect a series of highs or lows to highlight a market’s direction. An upward trend line connects higher lows and acts as a support level, while a downward trend line connects lower highs showing resistance. For example, drawing a trend line beneath a stock’s rising lows on TradingView can help a trader spot when the trend is weakening or about to reverse.

These are horizontal lines that indicate where support and resistance are likely to occur, based on the Fibonacci sequence. After a strong price move, Fibonacci retracements help anticipate potential reversal levels, such as 38.2%, 50%, and 61.8% retracements. For instance, if a currency pair rallies sharply and then starts a pullback, plotting Fibonacci retracements helps identify probable bounce zones for entering new trades.
Identifying support and resistance levels is essential for planning entry and exit points. These are price levels where the market has shown hesitation or reversal historically. Drawing horizontal lines on TradingView charts helps keep these critical zones in view. Traders might notice that a particular level acts as a strong support for the Pakistani stock market index, such as the KSE-100, prompting cautious buying near those points.
Mastering indicators and drawing tools on TradingView isn’t just about knowing what they are but learning how and when to apply them effectively. Combining these tools creates a fuller picture of the market, making it easier to navigate the often choppy waters of trading.
By mastering these basics, traders in Pakistan and beyond can better anticipate market turns and capture trading opportunities with confidence.
In the hustle and bustle of market trading, missing the right moment can mean the difference between a good trade and a missed opportunity. That's where alerts and notifications on TradingView come into play. They act as your eyes and ears when you can’t be glued to the screen, ensuring you catch price shifts or indicator signals as they happen. This feature is especially useful for traders in Pakistan who juggle markets with different time zones or multitasking between work and market watch. Alerts help traders stay on the ball without burning out.
Setting up an alert on TradingView is straightforward and tailored to keep you notified without info overload. To create one, first right-click on the chart at the price level you're interested in, or on a specific indicator's plot. Choose "Add Alert" from the menu. Here, you can customize the alert based on conditions like crossing a price, moving over a threshold, or changes in indicator values. For instance, if you want to know when the RSI crosses below 30, just select that condition.
This hands-on method means you're customizing alerts to your strategy signals — whether it’s a breakout price or an oversold condition. You can even set the alert's expiration, so it doesn’t pile up indefinitely if neglected.
TradingView offers several types of alerts that cater to different trading styles:
Price Alerts: Triggered when an asset's price hits or crosses a defined level.
Indicator Alerts: Based on technical indicators like MACD crossover or Bollinger Band touches.
Drawing Alerts: Trigger when price interacts with drawing tools like trend lines or Fibonacci levels.
Time-based Alerts: Notify you at specific times, handy for session starts or news releases.
Each alert type serves a purpose: price alerts for quick reaction trades, indicator alerts for technical signal followers, and drawing alerts for pattern traders. By picking the right one, you avoid noise and keep focus clear.
As market conditions shift, your alert setup needs tweaking — an alert set on a support level that’s broken may become irrelevant or misleading. TradingView allows easy editing and deleting alerts. You just go to the alert manager panel, which lists all your active alerts with details.
To edit, select the alert and adjust the conditions, frequency, or notification type. To delete, simply click the trash icon. This keeps your workspace neat and alerts meaningful, rather than cluttered with old signals. For example, after a strong run-up, you might delete the previous buy alert and set a new sell alert around the next resistance.
TradingView doesn’t just show alerts on your platform; it can push notifications through multiple channels:
Popup notifications: Immediate on-screen alerts while working on TradingView.
Email alerts: Send notifications to your email for reviewing missed signals later.
SMS alerts: Great for quick mobile updates, though dependent on regional support.
Webhook alerts: Useful for advanced traders wanting to trigger custom scripts or connect with third-party apps.
These options make sure you never miss critical moves whether you're at your desk or on the go, which is especially helpful in Pakistan's fast-moving Forex or crypto markets.
Setting well-timed alerts is like having a seasoned assistant keeping watch over your trades, freeing you to focus on decision-making without fearing you’ll miss the boat.
By mastering Alerts and Notifications on TradingView, you add a powerful layer of timeliness and precision to your trading toolkit. This can boost confidence and reduce the stress of constant market monitoring.
TradingView isn't just a powerful charting tool; it's also a thriving community where traders from all over the world hang out, share ideas, and learn from each other. For traders in Pakistan, getting involved in this social aspect can be a game changer. It helps you move beyond solo analysis and tap into diverse perspectives, real-time discussions, and a pool of shared knowledge. This means you’re not just staring at charts in isolation—you’re part of a global conversation that can sharpen your market insight and decision-making.
Finding trading ideas is one of the quickest ways to fuel your strategy. TradingView’s public ideas section offers a slew of chart analyses and trade setups contributed by users, ranging from beginners to pros. Instead of reinventing the wheel, you can explore different market views — for example, a Forex trader might come across a useful EUR/USD price action analysis shared by someone in Europe, while a Pakistani equities trader might find local stock breakouts highlighted.
Beyond just reading, it’s smart to watch for ideas that regularly gain traction and comments, as this usually means they're backed by solid reasoning. Use filters to narrow down ideas by asset type or strategy, so you get relevant suggestions without drowning in noise.
Evaluating community scripts requires a little critical eye. TradingView’s scripting language, Pine Script, lets users create custom indicators and strategies, many of which are freely available in the public library. While this is great for expanding your toolkit, not all scripts are created equal. Look for scripts that have positive user ratings, consistent updates, and clear documentation.
Try running new scripts on a demo or backtest environment first, especially before applying them to live charts. For example, an RSI-based custom indicator with added filters might seem promising, but without testing, it can lead to false signals. Always understand what each script does and avoid blindly trusting community tools.
Publishing charts is a straightforward way to contribute back and build your trading reputation. When you publish your charts on TradingView, you share your analysis with the community, whether it’s forecasting an oil price drop or highlighting a potential support level on the Karachi Stock Exchange. Make sure your charts are clear, with neatly annotated patterns or indicators that explain your thought process.
Published charts can attract feedback, spark discussions, and even help you get noticed by other traders or analysts. For traders keen on growing their network, regularly sharing insightful charts is a smart move.
Commenting and following traders helps you stay connected and informed. By engaging in conversations, asking questions, or offering your own views on others’ posts, you learn a lot and build relationships over time. Following experienced traders whose analysis aligns with your style means their ideas appear in your feed, saving you time on research.
In Pakistani markets, where localized insights can be scarce, interacting with fellow traders focusing on regional assets fills an important gap. This two-way interaction creates a dynamic learning environment far more efficient than going it alone.
To sum up, TradingView's social side spreads knowledge beyond charts. By exploring public ideas, scrutinizing scripts carefully, sharing your own work, and interacting with others, you create a feedback loop that strengthens your trading strategies and keeps you in tune with market sentiment.
Use filters and popularity indicators to sift through public ideas.
Test community scripts rigorously before relying on them.
Publish well-explained charts to build credibility.
Engage actively through comments and follows to learn and network.
By incorporating these social features into your daily routine, you enrich your market analysis and align yourself with a global community that pushes you to improve continually.
One of the strong points of TradingView is how well it plays with various brokers, allowing users to go from analysis right into action without switching platforms. For traders in Pakistan, this means a smoother workflow—less hassle toggling between apps, and quicker responses to market moves. Understanding which brokers work with TradingView and how to link your accounts makes a real difference when you want to place trades swiftly and accurately.
TradingView supports a broad range of brokers globally, including popular ones like Interactive Brokers, OANDA, Forex.com, and Tradestation. For Pakistani traders focusing on forex, OANDA and Forex.com are frequently chosen due to their robust global presence and low entry thresholds. Stock and futures traders might lean towards Interactive Brokers, which offers extensive market access and competitive fees.
Having these integrations means you can monitor charts and place orders directly, without hopping between sites. It's not just about saving time; it also cuts down on mistakes since you aren’t manually inputting trades after analysis.
Connecting your broker account to TradingView is straightforward, but it requires attention to detail for security and functionality:
Log in to your TradingView account.
Navigate to the 'Trading Panel' located at the bottom of the interface.
Select your broker from the list of available integrations.
Enter your broker’s account credentials (username, password). This often involves a secure OAuth process or API key, depending on the broker.
Grant necessary permissions to TradingView to access your account for executing trades.
Verify the connection by checking your account balance or order book directly from TradingView.
These steps may vary slightly depending on your broker’s requirements, so always keep your broker’s instructions handy.
Once connected, placing trades directly via TradingView is as simple as clicking on the chart. You can right-click a price level and select 'Buy' or 'Sell,' set stop losses and take profits using intuitive order boxes, and confirm the trade without leaving the screen. This immediacy helps when markets move fast—it’s like having your broker’s terminal built into your charting platform.
For example, if you’re watching the USD/PKR forex pair and spot a reversal pattern, you can execute your order right there, minimizing lag and keeping your trades timely.
While TradingView’s direct trading feature is handy, it’s not flawless:
Not all brokers are supported: Some local Pakistani brokers might not integrate with TradingView, limiting direct trading options.
Feature set varies: Advanced order types available on your broker’s native platform may not all be offered on TradingView.
Latency issues: Though generally minimal, there can be slight delays in order execution compared to direct broker platforms.
Security concerns: Linking accounts requires sharing credentials or API keys; ensure you only connect to trusted brokers and keep your information safe.
It's smart to double-check orders after placement and not rely solely on TradingView’s interface for crucial, high-volume trades.
Understanding these realities helps traders make informed decisions about when to use TradingView’s direct trading and when to revert to their broker’s platform for more complex needs.
In short, TradingView’s broker compatibility enhances the entire trading experience by tying analysis and execution closely. Just be sure to pick brokers that fit your trading style and verify integration details before depending on the platform for day-to-day trading.
Advanced features in TradingView provide traders with the tools to tailor their analysis, making it more precise and adaptable to unique trading styles. Customization isn’t just about aesthetics—it can significantly impact how efficiently you spot trends and make decisions. For instance, a trader focusing on Forex might require specific indicators or chart layouts that reflect currency volatility better than default settings. By diving into customization, you can create a workspace that aligns with your strategy instead of working around generic tools.
Pine Script is TradingView’s own scripting language designed to let users create custom technical indicators or alerts. Unlike more complex programming languages, Pine Script keeps things fairly approachable, even if you’re not a coding whiz. The language lets you define exactly how you want indicators to behave—for example, combining moving averages with volume trends to capture unique signals that aren’t available out of the box.
What this means practically is, if you find standard RSI or MACD not quite fitting your trading method, you can tweak or build your own. This level of customization empowers you to filter out noise and zero in on patterns that matter most to your trades. And since TradingView executes the scripts directly on their platform, it’s fast and doesn’t slow down your charts.
Say you want an indicator that blends the traditional Moving Average Convergence Divergence (MACD) with a momentum check based on volume spikes. Using Pine Script, you could program a custom indicator that triggers alerts only when both criteria align—helping you avoid false signals during low-volume trading hours.
Another instance could be a “volatility band” based on average true range (ATR) but adjusted for certain market hours, like when the Pakistan Stock Exchange is most active. This small tweak could give you a better sense of when prices are genuinely breaking out.
These custom indicators enhance your edge by fitting your unique trading window and preferences, rather than relying solely on generic tools.
One of TradingView's strengths is allowing you to view multiple charts simultaneously, each showing different time frames or even different assets. Setting up these multi-chart layouts is straightforward: just select the layout icon on the top bar and pick your preferred grid—whether that’s two charts side by side or a more complex four-pane view.
This setup is especially practical if you trade across timescales—say, using a daily chart for the bigger trend and a 15-minute chart to nail down entry points. Watching several charts at once helps you avoid tunnel vision and understand the broader market context better.
Multi-time frame analysis improves your trading decisions by providing confirmation across different periods. For example, spotting an upward trend on the weekly chart might get you thinking, but if the daily chart is showing signs of reversal, you’d likely wait before entering a trade. This double-check minimizes hasty moves driven by short-term volatility.
Also, when monitoring multiple markets like commodities and forex side by side, you can identify correlations or divergences that often indicate upcoming shifts. This layered approach is a big reason why professional traders often trust multi-time frame setups.
In short, customizing your TradingView workspace and diving into advanced features like Pine Script and multi-chart layouts can truly sharpen your market analysis. It’s not just about having more tools but using the right ones that fit your trading style and objectives.
Using TradingView efficiently means going beyond just opening charts. This platform offers tons of features that can feel overwhelming if not managed properly. The key is to tailor TradingView to suit your unique trading style and goals, which saves time and enhances decision making. For example, organizing your watchlist neatly or setting alerts smartly can prevent you from missing critical market moves. In this section, we cover some practical tips to help you get the best out of TradingView without drowning in data or wasting effort.
Breaking down your watchlist into clear categories is a straightforward but powerful way to manage your trading environment. Instead of shoving all stocks, forex pairs, and crypto coins into one big heap, try grouping them by asset type, market sector, or your trading approach. For instance, categorize Pakistani equity stocks separately from international tech stocks or separate short-term trades from long-term holds. This way, you won’t waste time scrolling through irrelevant assets when you want to focus on specific parts of your portfolio.
Using alerts effectively is another game-changer. Alerts in TradingView can be tied to price levels, indicator thresholds, or even complex conditions set via Pine Script—but too many alerts can become noise. Aim to set alerts only on critical levels that inform your strategy, like breaking support or resistance lines or MACD crossing signals. You might want to activate notifications via SMS or app push for important alerts, especially when away from your desk. This prevents endless screen checking and keeps you ready to make timely moves.
Setting clear goals before diving into analysis helps keep your trading focused and efficient. Whether you want to spot breakouts, monitor trend reversals, or track earnings impact on a stock, know your objective before fiddling with charts and tools. This helps avoid paralysis by analysis, where you lose hours scratching your head over data that doesn’t matter to your immediate goals.
Knowing when to act is as vital as when to watch and wait. TradingView offers tons of signals, but not all of them mean you should jump in instantly. Develop criteria for trade entry and exit based on your strategy and stick to them. For example, a trader might decide to enter only after a 4-hour candle confirms a bullish breakout or after volume spikes over a certain threshold. Delaying action waits for confirmation, reducing the risk of reacting to false alarms.
Efficient use of TradingView isn't about loading up with every tool available—it's about smart organization and timing your moves well.
These tips help you move through TradingView’s features with purpose, avoiding common pitfalls like information overload or impulsive trading. With practice, these habits become second nature, letting you trade smarter and with confidence.
TradingView is a powerhouse for market analysis, but it's not without its headaches. Traders often face hurdles like overwhelming data and questionable accuracy. Tackling these issues head-on makes your trading sharper and less stressful. Let's look at the typical problems and some realistic ways to dodge them.
One of the biggest headaches when using TradingView is the sheer amount of information hitting your screen. It’s easy to get buried under layers of indicators, charts, and news, which can cloud judgement rather than clarify it.
Filtering indicators is your first line of defense. Instead of piling on every fancy tool, pick a few that fit your trading style. For example, if you’re into swing trading, simple moving averages and RSI might give you clearer signals without the clutter. To streamline this, use TradingView’s indicator search to save favorites and create custom templates that focus on what really matters for your strategy.
Focusing on key data means knowing exactly which price points or market signals to trust. Don’t try to analyze twenty indicators; concentrate on the ones offering confirmed entry and exit cues. For example, let’s say you're monitoring the 50-day moving average crossover — this alone can often tell you more than a dozen others combined. By honing in on vital data, you save mental energy and can make decisions quicker and with more confidence.
In trading, false data is worse than no data. Sometimes feeds lag or glitch, causing incorrect price displays that could lead to costly mistakes.
Confirming price feeds regularly is crucial. TradingView pulls data from various exchanges and brokers, so double-check if your charts match live quotes from your broker or trusted financial news sources. A sudden jump or drop with no news backing it should raise a red flag. If you spot inconsistencies, refresh charts or switch data providers in the settings.
Verifying sources ties neatly into this. Always know where your information comes from. For cryptocurrencies, for instance, prices can differ noticeably between Binance, Coinbase, or Kraken. In Pakistan, where local market data might not be as updated, cross-reference with regional brokers or platforms like the Pakistan Stock Exchange’s official site. This practice ensures you make decisions based on solid ground.
Clear, accurate data combined with smart information filtering is what separates experienced traders from those drowning in noise. Take time to set up your TradingView workspace thoughtfully; it pays off in steadier, less stressful trading.
Addressing these common challenges helps you avoid pitfalls that often trip up beginners and pros alike. By keeping your TradingView experience clean and reliable, you empower yourself to make faster, better trading choices every day.
One of TradingView's strong suits is how it caters to traders interested in a wide range of markets and assets. This flexibility is crucial since traders often want to diversify or switch focus depending on market conditions. Whether you're tracking stocks, forex pairs, or cryptocurrencies, TradingView provides the tools to cover all bases in a single platform. Staying informed on several asset classes helps you spot opportunities or risks that might otherwise be missed if you only look at one market.
TradingView offers users access to thousands of equities from global exchanges like NYSE, NASDAQ, and the Pakistan Stock Exchange. This means Pakistani traders can analyze local stocks alongside international giants like Apple or Tesla. For forex, major pairs such as EUR/USD and USD/JPY are readily available, as well as many minor and exotic pairs. Cryptocurrencies like Bitcoin, Ethereum, and lesser-known altcoins are also featured prominently, reflecting their growing popularity.
The practical benefit here is obvious: you don’t have to jump between different platforms to watch these markets. The chance to track equities, forex, and crypto under one roof saves time and reduces hassle.
TradingView gets price data directly from exchanges and authorized third-party providers. For equities, this includes not just basic price quotes but extended hours data for those who trade pre-market or after-hours sessions. Forex data is usually streamed live from multiple liquidity providers, which keeps spreads and quotes tight and real-time.
In crypto, TradingView pulls data from popular exchanges like Binance, Coinbase, and Kraken. This ensures traders see accurate prices and volumes, which is key when markets are volatile. Plus, TradingView keeps historical data accessible, allowing back-testing strategies on past price movements.
Up-to-date and comprehensive data means better analysis and more confident trading decisions.
TradingView supports commodities such as gold, crude oil, natural gas, and agricultural products. This is a big plus for traders who want to hedge risks or explore seasonal trends in these markets. Charts come with various timeframes and include futures contracts information, helping traders understand supply-demand dynamics.
You can also set up alerts on commodity prices directly, which is handy when sudden geopolitical or economic events push prices sharply.
Indices like the S&P 500, Dow Jones, and the Pakistan KSE-100 index are covered extensively on TradingView. These broad market benchmarks offer traders insights into overall market sentiment without focusing on individual stocks. Traders can compare indices easily, spotting trends or divergences that hint at potential market shifts.
Using indices, you get a pulse on how big blocks of the market behave, which is useful for macro-level analysis and timing entry or exit points.
Diversifying your watchlist with commodities and indices helps capture market movements that individual asset tracking might miss.
In short, TradingView’s support across different markets and assets means Pakistani traders have plenty of options to build and adapt their strategies based on reliable data and flexible tools.
Wrapping up, understanding how TradingView fits your trading style and goals is important. This platform offers many tools that can simplify your analysis and decision-making, but it’s wise to judge it based on what you actually need. For example, a Pakistani trader focusing on Forex may find TradingView's Forex charts and broker integrations quite useful, while someone trading local equities might concentrate on chart customization and price alerts.
Your experience will also depend on whether you use the free features or opt for paid plans that unlock more advanced tools. Think of TradingView as a toolbox—you pick the tools that help you build your trading strategy effectively. The social features, charting capabilities, and compatibility with brokers are elements to consider when deciding if the platform serves you well.
TradingView stands out with its straightforward interface. Right from setting up charts to applying indicators, the process isn't riddled with technical jargon or overwhelming options. The drag-and-drop features, plus prebuilt templates, mean even someone new to technical analysis can get the hang of it quickly. Take the chart layout controls: you can switch between candlesticks, Heikin Ashi, or line charts with a couple of clicks without digging through complicated settings. This usability helps traders focus more on interpreting market moves instead of wrestling with the software.
One of TradingView’s real perks is its active and diverse user base. You get access to trade ideas, scripts, and analyses shared openly by traders worldwide—including many from Pakistan. This community-driven insight can be a practical second opinion or learning resource. For example, joining discussions on popular stocks or cryptocurrencies can reveal perspectives you might miss alone. Following experienced traders and engaging in comments gives a human touch to market data, making your analysis feel less isolated.
When you begin using TradingView, it’s best to keep things straightforward. Avoid flooding your charts with every indicator you read about and instead pick one or two that suit your trading style—like a simple moving average combined with RSI. This helps prevent confusion and data overload. For example, if you’re tracking the Karachi Stock Exchange, start with price charts and volume before layering on more complex tools.
Before diving into the paid options, new users should explore TradingView’s numerous free resources. The platform itself offers tutorials, community ideas, and script libraries that help sharpen analysis skills. YouTube channels and trading forums also provide lots of practical tips that cater specifically to Pakistani market setups. Getting comfortable with these no-cost resources lets you build confidence and understand what features are really worth paying for later on.
If you take away one thing, it’s that TradingView can be a powerful ally in your trading toolkit, but the key lies in knowing how to use it smartly without drowning in its many features.
By carefully evaluating these aspects, traders and investors in Pakistan can decide how TradingView fits into their trading journey effectively.
📊 Discover how to use TradingView.com for efficient market analysis with real-time data, charts, and tips tailored for traders in Pakistan.
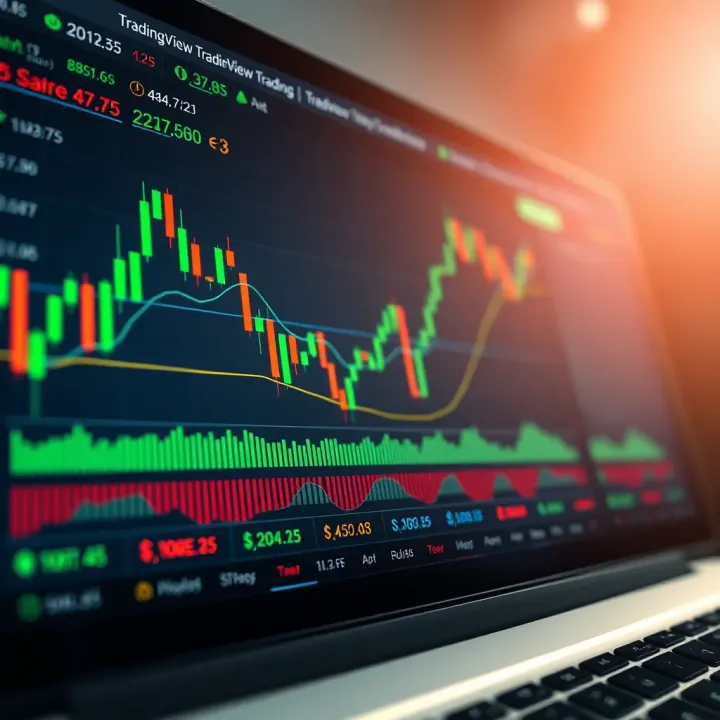
📊 Master TradingView charts with our practical guide! Learn chart types, indicators, drawing tools, and how to customize for smart market analysis in Pakistan.
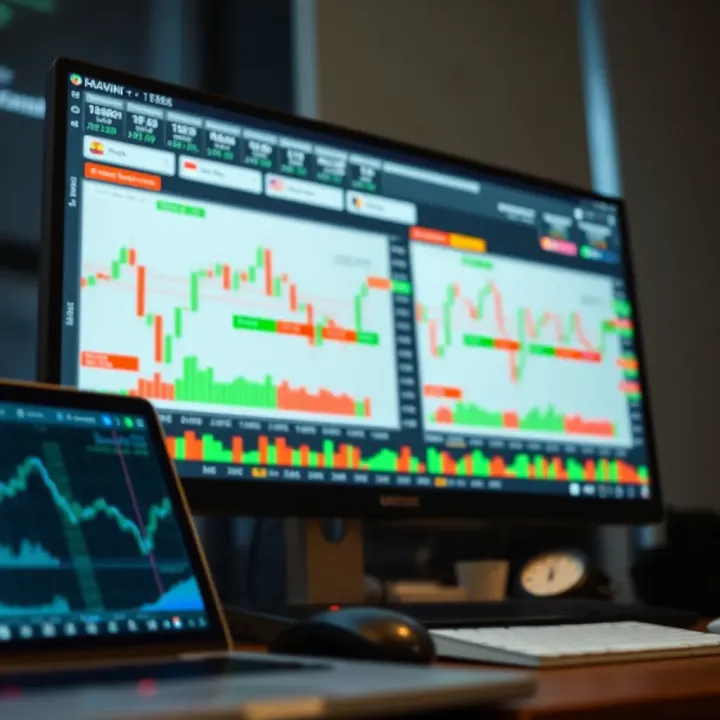
📊 Boost your trading skills with our practical guide to TradingView charts! Learn to analyze markets clearly and customize tools effectively in Pakistan. 🇵🇰

📊 Explore TradingView's tools, charts, and community for effective market analysis. Learn setup, market types & tips tailored for users in Pakistan 🇵🇰.
Based on 13 reviews