

Trading Chart Patterns Explained
📈 Learn key trading chart patterns to boost your skills. Discover valuable books & PDFs to navigate your trading journey with confidence and clear insights.
Edited By
James Whitmore
Trading chart patterns form the backbone of many effective trading strategies. Understanding these patterns helps traders anticipate price movements and make smarter decisions in the market. This guide breaks down key chart patterns—like head and shoulders, double tops, flags, and triangles—with a focus on how they can be used practically.
For traders in Pakistan, where market behavior can sometimes feel unpredictable, having a handy PDF guide on chart patterns offers a quick reference and study aid. It’s like having a map while navigating unfamiliar terrain—giving you more confidence to assess when to enter or exit a trade.

We'll cover what each pattern looks like, the psychology behind it, and how to spot it in real trading scenarios. Plus, this guide will highlight why a concise PDF is a valuable tool not just for beginners, but also for pros who need to refresh their memory on the go.
Whether you’re an investor analyzing company charts, a broker advising clients, or an educator teaching the ropes, this overview provides practical insights you can apply immediately. You won’t just learn about patterns—you’ll learn how to use them to make better calls in your trading journey.
Chart patterns offer traders a practical way to anticipate future price movements by observing how markets behave visually. They aren’t just pretty shapes on a screen; instead, they reflect the collective psychology of buyers and sellers over time. Understanding these patterns helps traders in Pakistan and elsewhere make decisions that are less about guesswork and more about informed planning.
For example, if you've noticed a stock forming a "double bottom" pattern, this might hint at a potential uptrend, signaling a good entry point. Conversely, a "head and shoulders" formation could suggest a reversal, warning traders to think twice about holding their positions. Having a solid grasp on these patterns minimizes surprises and improves timing.
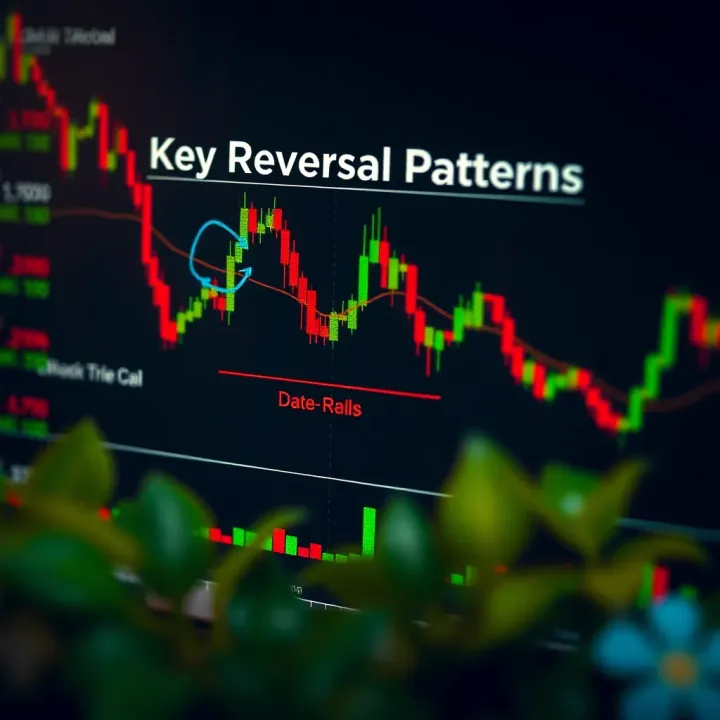
Chart patterns are specific formations created by the price movements of a security on a graph. These patterns generally fall into two groups: continuation and reversal. Continuation patterns suggest that the current trend is likely to continue, while reversal patterns may indicate the trend is about to change direction.
To put it simply, imagine you're watching traffic flow: a continuation pattern is like a steady stream of cars moving forward, and a reversal pattern is like a sudden U-turn at a busy intersection. Both types can give you clues about where the market's heading next. Traders use these patterns by scanning charts—often those of Pakistani stocks or indices—to spot setups that align with their trading plans.
Recognizing chart patterns is crucial because it provides an edge in trading by offering visual cues rather than relying purely on gut feeling or random guesses. Patterns help traders understand market sentiment and adjust their strategies accordingly.
For instance, in volatile markets like Pakistan's, where news events can shake prices quickly, a pattern like a pennant or flag might indicate a brief pause before prices resume their trend, allowing traders to avoid jumping in too early or missing out entirely. Moreover, knowing these patterns aids in setting more precise stop-loss and take-profit levels, which is vital for managing risk.
Trading with knowledge of chart patterns can significantly boost your confidence and decision-making, turning overwhelming charts into actionable insights.
In short, this introduction is your first step toward leveraging visual market behavior to plan trades smarter and navigate Pakistan's markets with more certainty.
Chart patterns form the backbone of technical analysis, helping traders make sense of market movements. Understanding the basic types of chart patterns is crucial because they provide visual clues about the potential direction of a stock or asset. For traders—whether you're following the Pakistan Stock Exchange or global markets—knowing these patterns means you can better anticipate price moves rather than just react to them.
Chart patterns generally fall into two main categories: continuation patterns and reversal patterns. Each tells a different story about what might happen next. Observing these patterns in real-time can give you an edge, especially when combined with volume analysis and other technical indicators.
Flags and pennants are short-term continuation patterns signaling brief pauses before a trend resumes. After a strong price move—say, a sharp rally in a popular stock like Pakistan’s Hubco—prices often consolidate in a tight range forming these patterns.
Flag: Looks like a small rectangle or parallelogram slanting against the prevailing trend. Imagine a runner pausing briefly to catch breath before continuing the race.
Pennant: A small symmetrical triangle that also signals a brief consolidation.
These patterns are meaningful because they suggest traders are momentarily taking a breather instead of reversing. Breakouts from these patterns offering clear entry points to ride the continuing trend. For example, during the rally of the oil sector, spotting a flag pattern might have helped traders capture the next upward leg.
Triangles are a bit like traffic signals signaling a potential breakout. They form when price action creates converging trendlines over time.
Ascending Triangle: Usually bullish, with flat tops and rising bottoms.
Descending Triangle: Often bearish, featuring flat bottoms and descending tops.
Symmetrical Triangle: Neutral, with both tops and bottoms converging.
In practice, if you spot an ascending triangle on Pakistan's cement stocks, you might expect a breakout upwards once price breaks resistance. These patterns tell you that market indecision is resolving, and a strong move is coming.
Both flags, pennants, and triangles help traders confirm that a trend is likely to continue, giving clear signals to enter or add to positions without chasing the market blindly.
The head and shoulders pattern is a classic sign a trend is ready to turn. It’s composed of three peaks, with the middle peak (head) higher than the two side peaks (shoulders). This setup often appears at the top of uptrends, signaling bearish reversal.
Imagine it like a mountain range, where the tallest peak hints that the climb is ending. For instance, traders in Pakistan’s banking sector could spot this pattern before a slowdown, letting them lock in profits before prices drop.
The key practical aspect here is the "neckline," a support line connecting the two lows. Once price breaks below the neckline on increased volume, it confirms the reversal.
Double tops and bottoms are signals that the current trend is losing steam.
Double Top: Two peaks at roughly the same level, signifying strong resistance and a potential downtrend ahead.
Double Bottom: Two troughs signaling strong support and a likely uptrend.
For example, in Pakistan’s textile futures, a double top formation might warn traders of an impending decline. The confirmation often comes when the price breaks below the valley between the tops.
These patterns are straightforward and powerful tools for making decisions about when to exit or enter trades, especially when paired with volume spikes, which add credibility.
Recognizing these patterns isn’t about crystal balls—it’s about reading the market’s handwriting to make smarter moves. In the context of a PDF guide, clear visuals and step-by-step instructions for spotting these formations can greatly boost trader confidence.
In summary, knowing basic chart patterns like continuation and reversal types equips traders with a reliable framework. These patterns, combined with other tools, help form a solid foundation for making informed, timely trading choices in any market, including Pakistan’s dynamic scene.
Reading chart patterns effectively is a skill that separates casual traders from serious ones. It’s not just about spotting shapes on the screen—it's about understanding what those shapes imply about market sentiment and likely price moves. For traders in Pakistan and beyond, this skill can turn guesswork into informed decisions. Let’s get into the nuts and bolts of what you need to know.
Volume is like the heartbeat behind a chart pattern. Patterns on their own might suggest a trend, but volume tells you how strong that trend really is. When you see a breakout from a pattern, confirm it with a spike in volume—this shows real interest and conviction from market participants. For example, if a double bottom forms in Pakistan's KSE 100 Index and the price breaks above the neckline on higher than average volume, it’s a stronger signal that the reversal is genuine.
Ignoring volume can be a rookie mistake; sometimes price moves without volume lead to false signals, making you jump in too soon or stay too long. So always check the volume bars whether you’re trading local stocks like Engro or international ones listed on PSX.
Time frames matter a great deal when reading chart patterns. A pattern visible on a one-minute chart might be a blip, but the same pattern on a daily or weekly chart carries more weight. For instance, a head and shoulders pattern on a 5-minute chart may lead to quick scalp trades, while the same on a monthly chart points toward a substantial trend change.
Local markets often exhibit volatility with sudden spikes during working hours. Pakistani traders should balance watching short term charts for quick entries and longer time frames for confirming overall trend direction. Combining multiple time frames—like confirming a breakout seen on a 15-minute chart with trends on the daily chart—can improve your odds.
A few pitfalls trip up traders more often than you'd think, even experienced ones:
Forcing Patterns: Sometimes, we want to see a pattern so badly that we twist the chart to fit our expectations. This cognitive bias causes misreading signals.
Ignoring Context: Patterns don’t exist in a vacuum. Market conditions, news events, and economic calendars need consideration. For example, a bullish flag during a political upheaval in Pakistan might suddenly fail.
Over-reliance on Patterns Alone: Patterns are tools, not crystal balls. They work best alongside other indicators and solid risk management.
Skipping Volume and Time Frame Checks: As we discussed, these are crucial steps that many traders overlook, leading to premature or delayed trades.
The best traders are not those who blindly follow chart patterns, but those who combine pattern reading with market context and volume analysis.
Mastering how to effectively read chart patterns requires practice, patience, and a healthy dose of skepticism. Using volume and time frames wisely helps spot the right moment to act, avoiding the traps that can hurt your trades. Take these insights seriously, and you’ll make smarter decisions with your trading chart patterns PDF guide right by your side.
Trading using chart patterns is a core skill for anyone serious about spotting market moves before they fully unfold. The key advantage here is turning visual clues on a price chart into actionable trading plans. In practice, this means identifying when a pattern signals a likely price move and knowing exactly when to step in or out of a trade. Without a solid strategy, these patterns are just shapes on a screen with little real world use.
Breakout trading is one of the most straightforward strategies tied to chart patterns. It involves entering a trade when the price moves beyond a well-defined pattern boundary – like a resistance line on a triangle or the top of a flag pattern. The idea is simple: once the price breaks out, momentum often carries it further in that direction. For example, if a stock has been trading between 100 and 105 for days and then suddenly jumps past 105 on increased volume, that’s a strong breakout signal to buy.
The trick in breakout trading lies in timing and confirmation. True breakouts usually come with higher-than-usual volume, which confirms that other traders are joining in. Jumping in too early may lead to false breakouts or “fakeouts,” while waiting too long could mean missing the initial surge.
Pullback trading complements breakout strategies nicely. Instead of buying as soon as the price breaks out, traders wait for a price retracement—known as a pullback—back towards the breakout zone or a moving support level. This is often considered a safer entry point because the initial surge exhausts some of the momentum and proves the breakout isn’t just a one-off spike.
For instance, after breaking above 105, the price might dip back to 104 before continuing upward. Buying at 104 during this pullback can offer a better risk-to-reward ratio, with a clearly defined stop-loss just below the breakout level. This method works well in markets where prices don’t move smoothly but have quick surges followed by pauses.
Even the best chart patterns and strategies won’t guarantee success every time. That’s where risk management comes in, helping traders limit losses and protect capital. A good practice is to always set a stop-loss based on the pattern structure—like just below the breakout point or under the pattern’s lower trend line.
Managing position size according to your total portfolio value is crucial too. Never risk more than a small percentage on a single trade, usually around 1–2%. That way, a string of losing trades won’t wipe you out.
Smart traders treat risk management not as an afterthought but as a fundamental part of their approach to chart patterns.
In sum, applying chart patterns effectively means combining pattern recognition with solid entry and exit tactics, alongside disciplined risk limits. The detailed knowledge in a PDF guide on trading chart patterns can be a handy reference, especially for traders who want to refine these strategies in the Pakistani market or beyond.
A well-crafted trading chart patterns PDF guide is more than just a file you download; it’s a handy tool that traders can pull up anytime they need a refresher or a quick reference. For traders in Pakistan, where market conditions can shift rapidly due to political and economic changes, having consistent access to a reliable guide can make a real difference in decision-making.
One of the biggest perks of having a trading chart patterns PDF is that it’s available on-demand—whether you're at your desk, on the train, or even during a quick coffee break. Unlike web pages that require internet and may be buried under layers of other content, a PDF sits quietly on your device, ready to be browsed offline. This ease of access means you can review chart patterns without distractions or slow loading times, keeping your focus sharp. For example, spotting a double top formation before a breakout during market hours becomes simpler with instant access to concise pattern summaries and guidelines right in your pocket.
For beginners, trading can feel like stepping into a maze without a map. A PDF guide breaks down chart patterns into digestible steps—showing how a pattern forms, the signals to look for, and what to expect next. Unlike scattered notes or fragmented online content, these step-by-step examples help beginners build confidence, avoiding the trial-and-error chaos traders often face. Imagine a novice trader learning how to identify an ascending triangle pattern through clear stages: first by spotting the rising support line, then confirming volume changes, and finally, recognizing the breakout point to place their trades efficiently.
Words alone can only do so much; charts and visuals bring patterns to life. PDFs typically include annotated charts showcasing real-world examples, highlighting key points like breakout zones or volume spikes. These visuals reduce guesswork and make it easier to remember patterns when you're scanning charts. For instance, seeing a labeled pennant pattern alongside commentary helps traders understand what subtle price movements to watch for, turning complex visuals into straightforward learning moments.
Consistency matters in trading. With a PDF guide, you can revisit concepts whenever needed to sharpen your skills or double-check a pattern before making a trade. Practicing with paper trading or demo accounts while following the PDF’s guidelines allows traders to test strategies without risking actual money. Additionally, over time, the PDF can serve as a personalized reference—perhaps with your own notes or highlights—making it a living document that grows with your trading experience.
Having a structured, portable, and visually rich PDF guide transforms trading chart patterns from abstract ideas into practical tools traders can rely on daily.
Finding good resources for downloading trading chart patterns PDFs is more than just a convenience. It’s about having reliable, clear information at your fingertips whenever you want to review or learn something new. Especially for traders in Pakistan, where markets can behave differently, having access to tailored, trustworthy guides can save heaps of time and confusion.
Good resources don’t just offer the file; they often provide updated content, practical examples, and easy navigation, helping you make the most of your learning experience. Instead of scouring the internet blindly, knowing where to look can mean the difference between a helpful guide and something that’s outdated or poorly explained.
When searching for trading chart patterns PDFs, it's important to focus on websites and platforms known for financial education and market analysis. Websites like Investopedia, BabyPips, and MarketWatch often offer downloadable material or link to resources that are easy to understand and regularly updated. For Pakistani traders, platforms like the Pakistan Stock Exchange official site or local financial blogs can provide insights specific to the region’s trading environment.
Forums and communities, such as TradingView or local Facebook groups dedicated to Pakistani traders, also share PDFs and other educational material. However, always check for credibility; a file from an unknown website with no clear author isn't reliable and might mislead you.
A well-crafted PDF should break down complex chart patterns into straightforward, digestible parts. Look for guides that use simple language and avoid jargon overload, making it easier for beginners and intermediate traders to grasp the concepts quickly. For example, a good PDF will clearly explain why a head and shoulders pattern indicates a trend reversal, or how volume changes confirm a breakout.
Practical tips or real-world examples included in the guide can significantly enhance understanding. If a PDF explains the pattern, then follows up with an actual example from a recent market scenario, it’s much easier to see how theory translates to practice.
Markets evolve, and so does the interpretation of chart signals and patterns. Make sure the PDF guide you download includes recent data or references current trading environments. Older resources might not account for new market behaviors influenced by changes in technology, regulations, or economic conditions.
A quality PDF will often mention the date of publication and may include updates or addendums reflecting changes in market conditions. This is vital, especially for Pakistani traders, where recent political or economic shifts can impact market movements and pattern reliability.
Choosing the right PDF guide means picking one that’s clear, practical, and up-to-date — helping you trade smarter, not harder.
Understanding how chart patterns behave in different markets is key to becoming a better trader. The Pakistani market has its own quirks—like unique volatility levels, trading hours, and the influence of local events—that affect how patterns play out. Simply put, what works on the New York Stock Exchange or London’s FTSE might not hold true for the Karachi Stock Exchange.
Chart patterns don’t exist in a vacuum. They reflect market psychology, which can shift with local economic factors. Political developments, foreign exchange fluctuations, and sector performance can all tweak how reliable certain patterns are over here. So, adapting your knowledge means recognizing these nuances and adjusting your approach.
Pakistani markets often experience sudden swings due to political announcements or changes in government policies. This means that patterns which typically indicate steady trends elsewhere might break down or lead to false signals here. For example, the "Head and Shoulders" pattern might look clear on the chart, but an unexpected decision from the State Bank of Pakistan could suddenly alter volumes and prices, making the pattern unreliable.
Volume is another key factor. In Pakistan, lower trading volumes on certain stocks can affect the clarity of patterns like "Triangles" or "Flags." When volumes are thin, price moves may not fully validate these patterns, so traders need to be cautious. Using volume alongside patterns can prevent falling into traps where the chart looks promising but doesn’t live up to the signal.
Seasonality also matters. The Pakistan Stock Exchange tends to have quieter periods during Ramadan or summer months, impacting liquidity and pattern formation. Patterns that develop during these times should be weighed carefully against more active periods.
In markets like Pakistan, it's vital to cross-check chart patterns with local news and volume data before making a trade decision.
Use Multiple Time Frames: Don’t rely on just one chart scale. Combine daily and weekly charts to confirm patterns. This helps filter out noise, which is common in the Pakistani market.
Monitor Economic Calendar: Keep an eye on major local events like budget announcements, political rallies, or State Bank meetings. These often cause sudden moves that break patterns.
Look for Volume Confirmation: Volume can be a pattern's best friend or worst enemy. Before acting on a pattern, check if volume supports the move. For example, a breakout in a "Pennant" pattern accompanied by high volume tends to have higher success.
Combine with Technical Indicators: Use moving averages or RSI alongside chart patterns to get additional confirmation. This can provide a better risk/reward scenario.
Practice with Local Stocks: Many traders get hung up trying to apply patterns from international markets to local stocks without adapting for liquidity or volatility. Start with blue-chip Pakistani firms like Habib Bank Limited or Engro Corporation to practice and understand how patterns behave here.
Adapting chart pattern knowledge to the Pakistani context isn’t just about translation—it’s about understanding the underlying market pulse. When done properly, this can give traders here a real edge in navigating their unique environment.
📈 Learn key trading chart patterns to boost your skills. Discover valuable books & PDFs to navigate your trading journey with confidence and clear insights.

📈 Discover popular trading patterns, risk management tips, and top PDF resources to boost your skills. Ideal for traders in Pakistan and worldwide.

📊 Explore key trading chart patterns with our detailed guide plus free PDF resources! Perfect for traders and investors in Pakistan aiming to sharpen strategies.

📊 Explore 7 key chart patterns in trading to spot market trends with confidence. Get a handy PDF guide for better analysis! Perfect for all traders in Pakistan.
Based on 5 reviews