
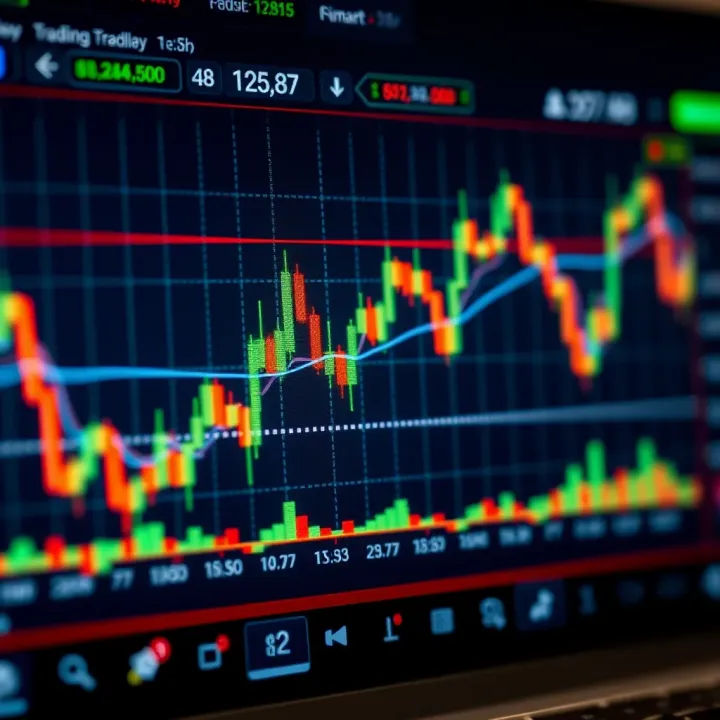
TradingView Guide for Traders in Pakistan
Discover how to master TradingView's advanced charts, tools & community features, tailored for traders in Pakistan to boost your trading game 📈🇵🇰.
Edited By
Edward Mason
Trading in today’s fast-paced markets demands access to reliable tools that make sense of complex data. For traders in Pakistan looking to sharpen their edge, integrating TradingView with Deriv.com offers just that—a powerful combo for better market insights and smarter decisions.
This guide walks you through how TradingView’s advanced charting capabilities blend seamlessly with Deriv.com’s trading environment. We will explore the critical features you need to know, from reading candlestick patterns to applying technical indicators tailored to your trading style. Whether you're a seasoned investor or just getting started, understanding this integration can elevate your trades.
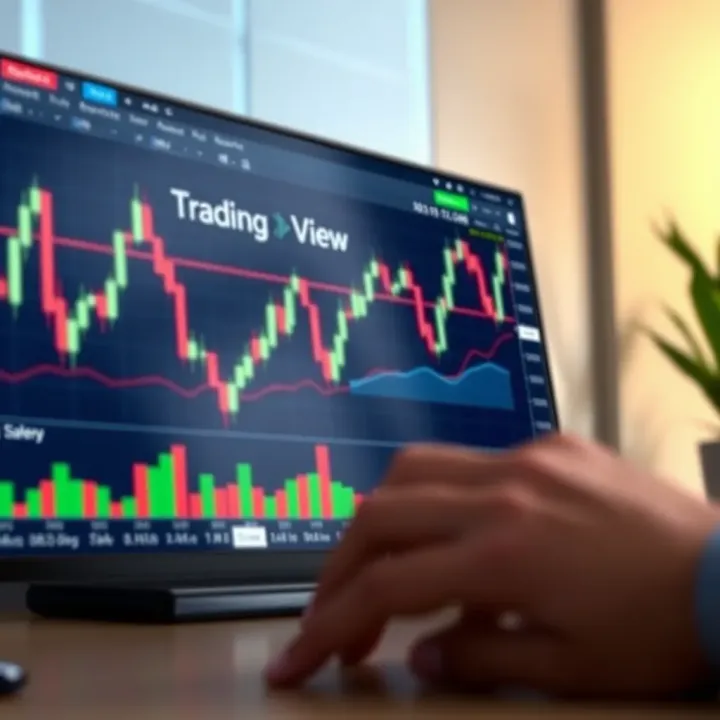
In the sections ahead, we’ll cover everything from basic setup to practical tips for optimizing your strategy. You’ll learn how to use chart tools that help reveal market trends and spot entry or exit points with greater confidence. Plus, we'll highlight how traders specifically in Pakistan can take advantage of localized features and what to keep in mind regarding market hours and routes.
Mastering the use of TradingView on Deriv.com isn't just about fancy charts—it's about turning data into clear, actionable insights that fit your trading goals. This guide is designed to make that process straightforward and effective.
Before diving deeper, it’s important to note that success in trading demands patience and practice. Tools like TradingView and Deriv.com can assist, but understanding the market context and your risk appetite remains key. With that in mind, let’s start exploring what makes this partnership a game-changer for traders in Pakistan.
Understanding the integration of TradingView with Deriv.com sets the stage for traders aiming to enhance their financial market experience. This section breaks down what TradingView offers and why its partnership with Deriv is a significant step for accessible, user-friendly trading. Practical benefits like advanced charting tools and seamless access to live markets make it a smart choice, especially for traders in Pakistan looking for reliable platforms.
TradingView is a web-based platform known for its robust charting and analysis features. At its core, it provides a range of chart types including candlestick, bar, and line charts that help traders visualize price movements clearly. You'll find plenty of drawing tools like trendlines, Fibonacci retracements, and support/resistance markers, making technical analysis more intuitive.
The platform also offers a huge library of technical indicators—think Moving Averages, RSI, MACD—that can be layered onto charts for comprehensive analysis. What makes TradingView stand out is its real-time data and social features, where traders share ideas, scripts, and strategies.
Traders choose TradingView because it combines depth with ease of use. Whether you’re a casual investor or a professional, the platform supports various experience levels without compromising on features. One trader might use it to spot trends through simple indicators, while another might automate alerts based on complex conditions.
Moreover, the community aspect makes it more than just charts—reading other traders’ insights or broadcasting your own analysis creates a dynamic learning environment. For those in Pakistan, this means tapping into global market knowledge without expensive software or background setup.
Deriv.com's integration with TradingView means you get the sophisticated charting and analysis tools directly on Deriv's trading interface. You don’t need to switch tabs or sign into separate platforms. When you open a trading chart on Deriv, it’s powered by TradingView’s engine — allowing you to draw, analyze, and then place trades on the same screen.
This tight fusion eliminates cumbersome workflows. For example, if you spot a breakout on the chart, you can instantly place a trade without losing time, which can be the difference in fast-moving markets.
This partnership brings some tangible perks:
Real-time Insights: Access to live charts with minimal lag helps in making timely decisions.
User-friendly Interface: Traders don’t have to juggle between tools; everything is compact and accessible.
Wide Range of Instruments: From Forex to cryptocurrencies and synthetic indices, users can analyze and trade multiple asset classes.
Customization: Tailor charts and indicators to your strategy and save these templates for quick use.
Having TradingView embedded in Deriv.com is a bit like keeping your toolkit right next to your workbench—no running around, just instant tool access for better, quicker trades.
In a nutshell, this integration puts traders in Pakistan and beyond on level ground, with powerful resources that were traditionally reserved for advanced desktop platforms. It’s a stepping stone for anyone serious about improving their trading skills and market understanding.
Getting started with TradingView on Deriv.com is the first step toward making more informed trading decisions. This section lays down the foundation for anyone new or seasoned to the platform. Knowing how to properly create an account, access the integrated TradingView service, and navigate its interface can save you heaps of time and reduce confusion. It’s not just about signing up — it’s about understanding what your tools look like and how you can tailor them to your needs.
The first thing you need before jumping into trading on Deriv.com is to set up your account. Registration is a straightforward process that requires basic personal information like your name, email, country of residence, and a secure password. They take care to comply with regulatory requirements, so be ready to verify your identity for security reasons. For Pakistani traders, this might involve uploading a valid CNIC or passport.
Opening a Deriv account means you’re stepping into a platform that supports multiple asset classes, from forex to indices. Once registered, you get access to funds management, trading platforms, and most importantly, TradingView charts integrated seamlessly into the ecosystem.
Keep your login details safe and activate two-factor authentication — this works like a second lock on your door, making your account harder to break into.
Accessing TradingView from your Deriv account couldn’t be simpler. After logging in, navigate to the trading interface and look for the TradingView chart option. Click it, and you’re instantly into a world of detailed charting and analysis tools. The integration means you don’t have to handle multiple logins or jumper between websites; everything is tucked under one roof.
This is especially handy when you want to quickly analyze price movements or set alerts before placing a trade. Deriv’s platform carries TradingView’s full set of tools, so there’s no bottleneck on features — the only limit is how much you want to learn and use.
Once inside the platform, the main dashboard serves as your command center. It displays your open positions, account balance, and quick links to various markets and tools. The layout is designed for traders who want to act fast without fumbling for the right options.
For example, you might see a list of your favorite assets at a glance, with their live prices and percentage changes. The dashboard also shows recent news snippets relevant to those assets — handy for staying updated without leaving the platform.
Getting comfortable here means you're less likely to miss a market move or an important alert, keeping your trading sharp.
This is where TradingView shines on Deriv.com. You can customize the chart exactly how you like it—choose from candlesticks, line, or bar charts; tweak colors; add multiple indicators; or draw trendlines to mark significant levels. Want to view multiple assets side by side? No problem, you can set up multiple chart windows for cross-market comparison.
For example, if you’re tracking USD/PKR alongside crude oil prices, monitoring them in a single layout helps spot correlations or divergences at a glance. The platform remembers your preferred layout, so each time you log in, it feels personal and ready-to-go.
Setting up charts to your liking isn’t just vanity; it streamlines your analysis and speeds up decision-making.
Tip: Use the snapshot tool within TradingView to save your charts. This way, you can keep a record of your technical setups or share them with other traders in your network.
Getting started may look simple on paper but mastering these initial steps paves the way for smarter trading on Deriv.com. Once you’ve set up your account, accessed TradingView, and got acquainted with the interface, you’ll find it easier to explore more advanced features in the coming sections.
Understanding the core charting tools and features on TradingView integrated with Deriv.com is like having the right toolkit before fixing a car. These tools are the foundation that helps traders analyze price movements, spot trends, and make informed decisions. Without mastering these basic elements, even the best strategies can fall flat.
The charting tools allow you to visually interpret the markets by customizing how data is displayed and analyzed. Whether you're a day trader watching minute-by-minute moves or a swing trader tracking patterns over weeks, these features adapt to your style. Using Deriv's version of TradingView means you access these tools with added convenience and real-time market data that matters for your trading decisions.
Traders from Pakistan will find this section particularly helpful because it offers actionable ways to monitor global market shifts efficiently, even if you're balancing between local trading hours and international sessions.
Candlestick, line, and bar charts each paint a different picture of market action. Candlesticks, popular among many traders, give a full snapshot of price action within a specific period—including open, high, low, and close. For example, a green candlestick with a long wick on top might indicate price rejection at a higher level, signaling potential reversal. Line charts, on the other hand, simplify the view by connecting closing prices, which is great for spotting long-term trends when you want to avoid noise.
Bar charts are somewhat of a middle ground, showing open, high, low, and close prices but in a less visually clustered way than candlesticks. Knowing when to switch between these charts can be your secret weapon. For instance, quick scalpers might prefer candlesticks on a 1-minute timeframe to catch tiny moves, while an investor might use a weekly line chart for a big-picture read.
Selecting appropriate timeframes is just as important as picking the right chart type. Timeframes dictate how much market data you focus on, and the “right” choice depends on your trading goals.
Day traders usually work within a 1 to 15-minute timeframe to catch intraday price swings.
Swing traders might prefer 4-hour or daily charts to spot patterns lasting from days to weeks.
Long-term investors typically use weekly or monthly charts to track fundamental trends.
Deriv.com's TradingView integration lets you flick between these timeframes hassle-free, which helps avoid paralysis by analysis. For example, if you're trading forex, switching between a 5-minute and a 1-hour chart can reveal entry points with better timing.
Choosing a time frame that suits your strategy avoids confusion and improves decision-making under pressure.
Trendlines, support, and resistance levels are like landmarks on the price map. Drawing trendlines helps visualize the direction of the market. For example, if you draw a diagonal line connecting a series of higher lows on a rising chart, it's an uptrend line, which can act as a dynamic support level.
Support and resistance zones indicate where prices have bounced back before or struggled to push through. Marking these levels helps traders anticipate where price might stall or reverse. Say the price on the EUR/USD pair has repeatedly bounced around 1.1800—that's your support zone to watch.
Using these tools effectively can prevent guesswork and help with timing entries or exits. For instance, placing a stop-loss just below a support level offers a logical safety net.
Marking key levels goes beyond simple trendlines; it includes highlighting Fibonacci retracements, pivot points, or psychological price levels. In volatile markets, a trader might mark the round number 1.2000 on the USD/JPY chart because traders often react strongly there.
Annotations also let you jot notes directly on the charts, reminding you why you marked a particular level or what patterns you observed earlier. It’s like leaving breadcrumbs for yourself when revisiting trades later.
Accurate marking and interpretation of these levels can reduce impulsive decisions and improve risk management.
Building your skills around these core tools will not only make you more confident but also improve trade timing and outcomes. The integration of TradingView on Deriv.com makes accessing and applying these tools straightforward, ensuring traders in Pakistan can compete effectively in the bustling global markets.
Technical indicators are essential tools for traders who want to make smarter decisions rather than just guessing on price movements. On Deriv.com, integrated with TradingView, these indicators help identify trends, momentum, and potential reversal points, which are crucial for timing trades properly. Using them effectively means not just slapping indicators on charts but understanding what each signal means and adjusting them to your trading style.
Moving averages (MAs) smooth out price data to help spot trends over time. The most common are the Simple Moving Average (SMA) and the Exponential Moving Average (EMA). While SMA gives equal weight to all past prices, EMA focuses more on recent prices — making it quicker to react to new information. For instance, a 50-day EMA crossing above the 200-day EMA often signals a bullish trend, sometimes called a "golden cross." On Deriv, traders can use moving averages to spot when an asset might be gaining momentum or potentially pulling back. A practical tip: use short-period MAs for quick signals and longer ones to confirm the overall trend.
Relative Strength Index (RSI) measures how overbought or oversold an asset is, ranging from 0 to 100. Typically, RSI values above 70 mean an asset might be overbought (possible pullback ahead), while below 30 indicates oversold conditions (potential reversal upward). In volatile markets like cryptocurrencies on Deriv, RSI can help avoid buying at a peak.
MACD (Moving Average Convergence Divergence) compares two EMAs and reveals shifts in momentum. When the MACD line crosses above its signal line, it suggests a buy signal; crossing below means sell. Traders use MACD to catch trend shifts early without waiting for price confirmation.
Bollinger Bands consist of a middle moving average with upper and lower bands indicating volatility. When price squeezes inside the bands, it often precedes a sharp move. For example, a breakout beyond the upper band can foresee strong upward momentum. Bollinger Bands are especially handy for spotting breakouts or range trading opportunities.

Alerts can save you from staring at the screen all day. With TradingView on Deriv, you can set alerts based on precise conditions — like price crossing a moving average or RSI exceeding 70. Custom alerts mean you don’t miss crucial moments to enter or exit trades. For example, you might want an alert when the MACD line crosses the signal line on the 15-minute chart, letting you act fast. The key is tailoring your alerts to your strategy so they're useful instead of noise.
Managing your alerts effectively means keeping your notifications clear and actionable. Too many alerts can overwhelm you, leading to missed opportunities due to alert fatigue. On Deriv, you can organize alerts by priority or type, and choose how to receive them — email, mobile push, or on-platform notifications. It helps to review and adjust your alerts regularly, pruning the ones that no longer fit your strategy or market conditions.
Effective use of technical indicators and well-managed alerts can be game-changers in trading, giving you an edge without requiring nonstop monitoring. Always test and tweak your setups in a demo before risking real money.
In summary, picking the right indicators like moving averages and RSI, then backing them up with timely alerts on Deriv.com, lets you spot opportunities and manage trades better. This combination of tools and smart alerting fosters disciplined, informed trading rather than shooting in the dark.
Trading strategies form the backbone of any successful trading experience, especially when using a powerful tool like TradingView on Deriv.com. These strategies help traders make informed decisions, minimize risks, and spot profitable opportunities through technical analysis and proper risk control. For traders in Pakistan and beyond, combining TradingView’s advanced charts with Deriv’s trading environment offers a practical edge — it’s like having a detailed map to navigate the unpredictable landscape of the markets.
One of the smart moves in technical analysis is blending multiple indicators to confirm trade signals. Instead of relying on just one indicator like RSI or MACD, traders often combine them to filter out misleading signals. For example, pairing a 14-day RSI with Bollinger Bands can tell you not only if a stock is overbought or oversold but also whether it's trending strongly or bouncing inside a range. On TradingView integrated with Deriv, you can easily layer these indicators on the chart — watching for moments when RSI dips below 30 (indicating oversold conditions) while the price hits the lower Bollinger Band. This double confirmation helps traders enter trades with higher confidence.
The key here is avoiding indicator overload. Using too many indicators can cloud judgement and cause hesitation. Stick to two or three that complement each other, such as a momentum indicator combined with a trend indicator.
Chart patterns often speak louder than indicators alone. Recognizing shapes like head and shoulders, double tops, triangles, or flags can provide clues about potential price movements. For instance, spotting a bullish flag on a 1-hour chart on TradingView when trading forex on Deriv might signal a continuation of an uptrend, alerting you to a good entry point.
Understanding these patterns requires practice, but once you get the hang of it, they become valuable signals. Use trendlines and annotations directly on TradingView charts to mark these formations. It also helps you backtest past price movements to see how these patterns have played out historically, honing your intuition and timing.
Deciding how much to invest per trade—position sizing—is fundamental in protecting your account from big losses. It’s tempting to put a large chunk of your capital behind a "sure thing," but even the best strategies can fail. A common approach is to risk only 1-2% of your total trading account per trade.
For example, if your Deriv account balance is $1,000, risking 2% means you’d risk $20 on a single trade. Using TradingView’s risk-reward tool on the chart helps visualize this—setting stop loss and take profit levels accordingly. This method keeps your losses manageable and lets you stay in the game longer.
Stop loss and take profit orders are your safety net and target marker, respectively. Stop loss prevents you from losing more than you’re comfortable with if the market moves against you. Take profit locks in gains before the market can reverse.
On TradingView via Deriv, setting these levels directly on the chart is intuitive. For example, after spotting a support level with TradingView’s drawing tools, you could place a stop loss just below it. Similarly, take profit can be set near a recent resistance or based on a predefined risk-reward ratio like 1:2 — risking $10 to gain $20.
Effective risk management isn’t just about limiting losses—it’s about ensuring that your wins can outweigh your losses over time. Without setting these controls, even the best trading strategy can fizzle out.
In short, blending technical analysis with sound risk management techniques like position sizing and using stop loss/take profit orders will position traders to navigate markets with discipline and clarity on Deriv using TradingView. This combination empowers you not just to spot trades, but to manage them sensibly to build steady growth.
TradingView's social features add a dynamic edge to trading on Deriv.com by connecting you to a broad community of traders. These tools allow you to tap into collective knowledge, exchange ideas, and even improve your own trading approach by learning from others. In the fast-moving markets, having access to a variety of viewpoints and strategies can be a game changer.
Diving into community-shared strategies on TradingView is like entering a hive mind of trading wisdom. These strategies, often laid out by experienced traders, are publicly available and can give you a fresh perspective on market moves. For example, you might find a unique way someone uses Bollinger Bands combined with RSI to pinpoint entry points on Deriv’s platforms. This not only saves you time in research but also lets you test proven setups.
Look for strategies that have high engagement and positive feedback, as these generally indicate reliability.
Try paper trading with these strategies first before applying them in live markets to measure their fit with your style.
Custom scripts take TradingView’s social aspect a step further by letting you apply or even modify coded indicators and strategies. This feature lets traders personalize tools that suit their specific needs. Suppose you want a custom indicator that highlights sudden volume spikes — you can search for existing scripts or write your own using TradingView’s Pine Script editor.
Experiment with scripts that automate alerts for certain setups; this cuts down the monitoring time dramatically.
Sharing your scripts with the community can get you valuable feedback and improvements.
Following successful traders on TradingView can bring a stream of timely insights straight to your dashboard. By observing their trade ideas, comments, and performance over time, you can grasp how they react to market shifts and apply similar methods thoughtfully. This is especially handy for traders in Pakistan who want to compare global market perspectives with local trends.
Create a watchlist of traders whose analysis aligns with your goals.
Engage with them by commenting to clarify doubts or get additional tips.
Sharing your own market analysis not only cements your understanding but opens doors to collaborative growth. Posting charts, trade plans, or market outlooks fosters discussion and often draws constructive critique from more seasoned traders. For instance, after posting a trade setup based on Deriv instruments, community feedback might highlight overlooked risks or confirm your strategy’s strength.
Be clear and concise in your posts, highlighting your rationale to invite meaningful discussion.
Regular posting builds your reputation and might help you connect with like-minded traders.
TradingView’s social tools offer an interactive way to enhance your trading skillset by learning directly from the community and contributing your own voice.
Being able to trade on the go is a real game-changer today, especially for traders using TradingView on Deriv. Markets don't sleep, and neither should your ability to react. Mobile trading gives you the power to keep an eye on charts, place trades, and manage your positions anytime, anywhere — all from your smartphone. For traders in Pakistan, this means you can seize opportunities as they happen, whether commuting, at a café, or even during a family gathering.
Staying connected to the market through mobile devices ensures you're never out of the loop, helping you act fast and smart.
TradingView's app on Deriv is built to fit right into your pocket without losing the muscle of the desktop version. It supports interactive charts, multiple indicators, and drawing tools that let you analyze price movements with ease. For instance, switching between candlestick, line, or bar charts is just a tap away, and you can apply your preferred technical indicators like RSI or Bollinger Bands without any hassle.
Plus, the app’s user interface feels natural on small screens — buttons aren't crammed, and menus remain easy to navigate. This means you won't find yourself squinting or fumbling when trying to place orders or review your trade setup. Let's say you're checking a sudden breakout on EUR/USD; you can pull up your chart, draw trendlines, and make decisions within seconds.
One of the best bits is how your workspace on the mobile app syncs flawlessly with the desktop browser version. Your saved chart layouts, alerts, and watchlists show up instantly, so you don’t need to recreate your setup every time you switch devices. For example, if you craft a custom indicator on your laptop during the day, it'll be right there on your phone when you check prices in the evening.
This seamless syncing is a huge time-saver and reduces mistakes caused by outdated data or settings. It means you can start your analysis at home and keep it going while waiting in line at the bank or during a quick break.
Receiving timely alerts on your phone can make all the difference in a fast-moving market. Deriv’s TradingView integration lets you set up custom alerts for price levels, indicator signals, or even specific patterns. This way, you don’t have to stare at the screen all day. Suppose you’re watching the BTC/USD pair; you can set an alert for when the RSI crosses into oversold territory so you can prep for a possible bounce without constant monitoring.
Setting alerts from your phone is straightforward, often just a couple of taps, and you can tailor them with sound notifications or vibrations to suit your environment. This practical feature helps keep you focused on your day while staying connected to potential trade setups.
Speed matters, and the mobile app knows it. Deriv’s TradingView app allows quick order placement directly from charts, meaning you don’t have to jump through hoops to execute a trade. You can enter, modify, or cancel orders swiftly with well-placed buttons and intuitive order panels.
For example, if you spot a breakout on the 15-minute chart, you can place a buy order right there without navigating away or risking missing out due to delays. The app also supports setting stop loss and take profit levels during order entry, which ensures your risk management stays tight even during fast market moves.
Mobile trading with TradingView on Deriv combines convenience with functionality, letting traders in Pakistan stay on top of their game no matter where they are. It’s about bringing the full trading desk experience into your hand, without compromise.
Trading on TradingView via Deriv.com offers many perks, but it isn’t always smooth sailing. Traders, especially those new to the platform or even seasoned ones, often hit some bumps that can trip up their efficiency or decision-making. Understanding common challenges not only saves time but boosts confidence and helps you stay on course. In this section, we focus on typical technical headaches and trading pitfalls, pairing each with practical ways to get past them.
Nothing’s more frustrating than a shaky connection when you’re trying to execute trades or monitor charts. On Deriv with TradingView, connectivity issues may stem from your internet provider, server loads, or local network glitches. This can cause delays, missed price moves, or worse—failed orders. To handle this, first, check your internet stability using speed tests regularly. Using a wired connection instead of Wi-Fi often cuts down interruptions. Deriv offers status updates if their servers are down, so keeping an eye on those can save you from unnecessary panic. Restarting your device or clearing cache in your app/browser also helps if the platform feels sluggish.
Always have a backup plan: keep your phone or a secondary device ready with the Deriv app installed, so if your main setup goes down, trades can continue without major delays.
Sometimes charts simply won’t load or freeze, which can send your analysis off the rails. These errors can be related to browser incompatibilities, cache issues, or even bugs in TradingView’s integration. Try refreshing the page or switching browsers—Google Chrome and Firefox tend to work best with interactive trading platforms. Clearing cookies and cache resolves most stuck chart problems, as stored data can get corrupted over time. Another useful trick is reducing the number of indicators or drawing tools active at once, since too many on screen can slow down loading times. If the problem persists, reporting the issue to Deriv’s support enhances their problem-tracking and often speeds up fixes.
Overtrading is a trap many fall into, especially when the market is volatile or when you feel the urge to chase every small movement. It leads to unnecessary fees, emotional exhaustion, and a messy trade log. On TradingView with Deriv.com, you'll have all these tempting tools and indicators at your fingertips, but restraint is golden. Set clear daily or weekly trade limits, and stick to a trading plan that includes entry and exit rules. For instance, you might decide to place no more than three trades a day or only trade setups that meet your pre-defined criteria. Taking breaks and reviewing past trades can help avoid jumping in impulsively.
A critical mistake is overlooking risk management features, like stop losses and take profits, which are available in Deriv’s platform. Ignoring them can lead to heavy losses, especially in fast markets. Using TradingView’s alert system to trigger notifications when price hits certain levels can keep risk inline without staring at the screen 24/7. Always calculate your position size based on how much loss you’re willing to accept. For example, risking 1-2% of your account per trade is a simple rule that prevents any one trade from wrecking your balance. Set stops slightly behind key support/resistance levels identified on your charts to give trades room to breathe but still protect your capital.
Remember: No system guarantees wins, but disciplined use of risk controls keeps you in the game longer and prepares you for consistent growth.
By being aware of these challenges and acting on them, traders on Deriv.com using TradingView can navigate the platform more smoothly and keep their focus on smart trading rather than tech headaches or common errors. This practical approach reduces stress and increases the chance of steady success in Pakistan’s dynamic trading scene.
TradingView integration on Deriv.com opens new doors for traders in Pakistan. With limited local platforms offering such sophisticated charting and analysis tools, having access to this combined resource allows Pakistani traders to compete on a more level playing field. It’s not just about accessing tools, but how these tools enable smarter decisions and better timing in trading.
For instance, a trader in Karachi might use TradingView's advanced charting to spot a breakout pattern on an international currency pair, then execute the trade on Deriv within seconds. This immediacy and insight can turn the tide in volatile markets where every second counts.
Deriv provides Pakistani traders with access to a wide range of financial instruments, including forex pairs (like USD/PKR, EUR/USD), commodities (gold, silver), indices (S&P 500, FTSE 100), and cryptocurrencies such as Bitcoin and Ethereum. This variety means that traders are not confined to the limitations of local exchanges or currencies; they can diversify their portfolios and tap into global economic trends.
Having such instruments availabel on one platform means you can monitor correlations—for example, how gold moves relative to the Pakistani rupee—and strategize accordingly. Being able to trade CFDs and binaries on these assets adds flexibility, allowing traders to profit in both rising and falling markets.
Understanding market hours is key. Global markets operate in different time zones with their own peak activity sessions—for example, the New York stock exchange opens 5 PM to 12 Midnight PST, while the London market runs from 10 AM to 7 PM PST. Deriv aligns its offerings accordingly, enabling Pakistani users to access these markets during their active trading periods.
This timing is crucial. Trading during peak hours means better liquidity and tighter spreads, which directly impacts trade execution and profitability. For example, forex volatility often spikes during overlaps in London and New York sessions, presenting prime opportunities for day traders.
Knowing the market sessions helps you avoid trading in thin markets, where price movement can be erratic due to low volume.
Pakistani traders should be aware of local rules surrounding online trading and forex to stay clear of legal troubles. Currently, the State Bank of Pakistan restricts forex brokerages operating within the country, but platforms like Deriv, operating offshore, are accessible with caution.
It’s important to comply wit local laws by, for example, keeping accurate records of your trades for tax purposes and avoiding unregulated brokers. Pakistani regulators tend to emphasize avoiding scams, so using a reputable and regulated platform like Deriv provides a layer of safety and transparency.
Safety is a concern for many traders new to online platforms. Using Deriv integrated with TradingView means handling sensitive info and funds securely. Always enable two-factor authentication and use strong, unique passwords to protect your accounts.
Additionally, be wary of phishing attempts or unsolicited advice via social media channels, which are common traps in our digital age. Also, start with demo accounts to familiarize yourself with platform features and risks without exposure.
Playing it safe helps you focus on trading strategies instead of worrying about account integrity.
By understanding these local considerations and making the most of the global instruments and market hours, Pakistani traders can maximize their trading outcomes using TradingView on Deriv.com.
Maximizing the use of TradingView on Deriv can significantly improve your trading precision and efficiency. The platform offers a suite of features that, when properly tailored and used, can give you a competitive edge. From customizing the workspace to staying updated with the latest market news, these tips help traders enhance decision-making and respond more swiftly to market movements.
Saving chart layouts on TradingView allows traders to preserve their preferred settings and tools across sessions. For example, if you analyze the forex market with certain indicators like Moving Average and RSI positioned in a specific way, saving this layout means you don’t need to set it up every time you log in. This saves precious time and prevents disruption in your workflow, allowing quick access to your preferred analysis setup.
To save a chart layout, simply set up your charts with the desired indicators, draw tools, and timeframes, then use the save function to name and store it. On Deriv, multiple saved layouts can be efficiently toggled depending on the asset or strategy you’re working on.
TradingView on Deriv supports multiple chart windows simultaneously, which is a game changer for monitoring different markets or timeframes without switching tabs. Say you're watching currency pairs and cryptocurrencies right next to each other; this feature lets you keep an eye on various assets live.
This multi-window setup is especially helpful for day traders or scalpers who must react rapidly to price changes across different instruments. Organizing your workspace to display a 1-minute chart of EUR/USD beside a 30-minute BTC chart, for instance, helps you spot correlations or divergences more easily.
Keeping up with financial news is a simple yet potent way to improve trading decisions on TradingView with Deriv. Real-time information on global economic events, government policies, or corporate earnings can influence market trends dramatically. For example, knowing when the State Bank of Pakistan announces a policy rate change can prepare you for currency volatility.
Integrate trustworthy sources like Bloomberg, Reuters, or local financial news channels into your routine, and monitor economic calendars. This practice allows traders to understand context behind price moves and avoid blind trades.
Learning doesn’t stop after opening a trading account; continuously engaging with tutorials can sharpen your skills. Deriv.com offers helpful tutorials and webinars that guide users on charting techniques, using technical indicators, and applying risk management effectively.
Additionally, TradingView’s own tutorials and community scripts expose you to various trading styles and strategies. By actively participating in these learning opportunities, you can adapt new methods suited to your trading style and improve overall confidence in executing trades.
Remember: The market isn’t static, and neither should your learning process be. Always be ready to adapt and refine your skills.
With these approaches, traders on Deriv using TradingView can improve their setup, reaction time, and knowledge base, which are all crucial for successful trading in Pakistan’s dynamic markets.
Wrapping up a guide like this is more than just a formality; it’s where all the pieces come together for you as a trader using TradingView on Deriv.com. Summarizing the key points helps clarify what tools and strategies really matter, while next steps provide a pathway—from theory to actual trading action. This section gives you a roadmap for how to apply what you’ve learned in real trading scenarios.
Effective summaries highlight the most useful aspects without muddying the waters, and practical next steps keep you from feeling lost once you switch from reading to doing. For example, understanding chart setups and indicator combinations is great, but knowing how to jump into a demo trade and then transition smoothly into live markets ensures you're ready for real-world conditions, especially for traders in Pakistan who might be new to these integrated platforms.
TradingView on Deriv combines the power of professional charting with a robust trading platform. This integration simplifies your workflow by allowing seamless access to interactive charts alongside live trading features—all in one place.
Practically, this means faster responses to market changes since you don’t need to switch between apps. The variety of indicators and drawing tools helps you tailor analysis to your style whether you're scanning minor trends or diving into long-term patterns.
For example, when looking at BTC/USD, you can instantly apply Bollinger Bands on TradingView to spot volatility swings, then execute trades directly on Deriv.com without losing time. This unified approach reduces risks tied to delays or missed info.
Stick to these to get the most out of your experience:
Customize your workspace. Save preferred chart layouts so you’re not resetting every time you log in.
Use alerts wisely. Set clear entry and exit triggers to avoid emotional decision-making.
Start small. Even after mastering the platform, begin live trading with manageable stakes.
Keep learning. Follow market news and engage with tutorial content regularly.
These habits shape discipline and improve consistency while preventing common errors like overtrading or misreading signals.
Moving from demo to live trading can feel like stepping off a bike’s training wheels. The demo paints an ideal scenario, but live markets introduce emotions and real stakes. Take it slow by:
Gradually increasing your investment size.
Testing all new strategies on demo before going live.
Keeping a journal of trades to identify what works and needs adjustment.
For instance, if you made profits trading USD/JPY on demo, replicate the same setups, but reduce position sizes initially on your live account. This helps acclimate to the pressure without risking too much.
Keeping a close eye on your trade once it’s open is vital to catch sudden market shifts. Use TradingView’s alert system on Deriv to notify you of price hits, indicator crossovers, or trend changes so you’re not glued to the screen 24/7.
Combine this with stop loss and take profit orders to automate exits and safeguard your capital. Regularly review your open trades and market conditions to decide if adjustments are needed.
Successful traders know that managing the trade after you enter is just as important as choosing the right entry point.
By taking these steps seriously, you equip yourself to handle the ups and downs efficiently, steering your trading career in a sustainable direction.
Discover how to master TradingView's advanced charts, tools & community features, tailored for traders in Pakistan to boost your trading game 📈🇵🇰.

📊 Learn how to connect TradingView charts with Deriv seamlessly! Step-by-step setup guides and smart tips for traders in Pakistan to improve trade analysis and execution.

Discover how traders in Pakistan can blend TradingView's charts with Deriv's platform for informed market analysis and smarter trading decisions 📈💹🇵🇰
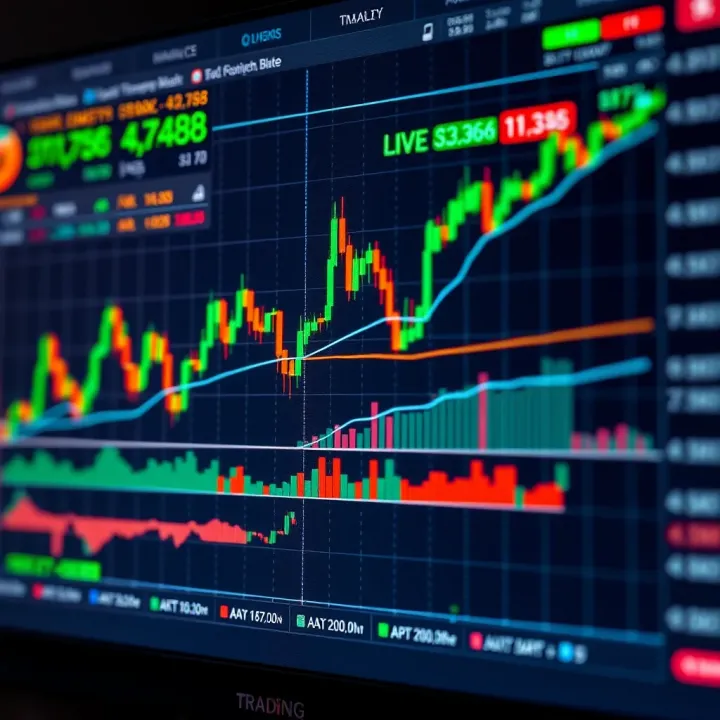
Explore TradingView live charts 📊 for traders in Pakistan 🇵🇰. Learn to customize, analyze with real-time data, and make smarter trading moves today!
Based on 6 reviews