

Using TradingView for Binary Options Trading
📊 Learn how to use TradingView for binary options trading in Pakistan 🇵🇰. Get practical tips on charts, indicators, & market analysis to improve your trades!
Edited By
James Thornton
Binary options trading can seem like a quick way to earn money, but without the right tools and knowledge, it often feels like shooting in the dark. This guide focuses on how TradingView — a popular charting platform favored by many traders — can be a real game-changer for those involved in binary options.
TradingView offers a rich set of features such as advanced charting, numerous indicators, and community-driven ideas, which are sometimes overlooked by traders sticking solely to their binary options platform. Understanding how to use these tools in tandem with your trading strategies can boost both your confidence and your results.
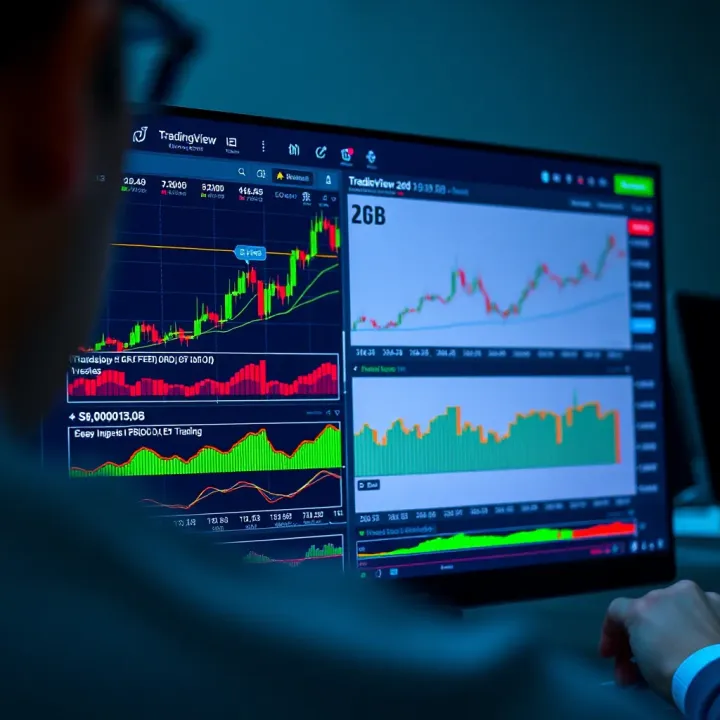
Here, we’ll cover how to get the most out of TradingView for binary options, including practical tips on setting up charts, picking indicators that matter, interpreting signals, and avoiding common pitfalls. Whether you’re new to binary options or have some experience, this guide will provide concrete steps to tighten your trading decisions.
Good trading isn’t about luck; it’s about making informed choices based on solid data and analysis.
By the end, you'll have a clearer grasp of how to combine TradingView’s insights with your binary options trades to make smarter, more strategic moves. Let’s get into it and turn those charts into opportunity.
Understanding the basics of TradingView and binary options sets the foundation for using the platform effectively in trading. This section highlights why getting familiar with both is essential before diving into chart analysis and strategy development. For example, knowing how TradingView organizes data and what binary options entail can save time and avoid costly mistakes.
TradingView is an online charting platform that offers powerful tools for market analysis. It supports a vast range of financial instruments including stocks, forex, cryptocurrencies, and commodities. For binary options traders, TradingView provides real-time charts and trading ideas, which help make informed decisions quickly.
Unlike many basic charting tools, TradingView allows customization and social sharing where traders can discuss strategies. Imagine spotting a sudden spike in the crypto market; with TradingView, you get instant visual feedback to decide whether that asset is a good binary options choice.
There are several features on TradingView that binary options traders find handy:
Interactive charts: Adjustable time frames and numerous chart types like candlestick or bar charts.
Technical indicators: Popular tools such as Moving Averages, RSI, and Bollinger Bands help identify market trends and potential reversal points.
Custom Alerts: Traders can set alerts on price movements or indicator signals, crucial for timing binary options trades since these trades often depend on precise entry points.
Community insights: Access to ideas shared by other traders can reveal fresh perspectives or confirm your trade setup.
The beauty of TradingView lies in its intuitive interface and the ability to tailor tools to your trading style, making it more than just a chart viewer but a practical trading assistant.
Binary options are a straightforward form of trading where you predict whether an asset’s price will be above or below a certain level at a specific time. It's like placing a bet on the outcome: if you’re right, you get a fixed payout; if not, you lose the invested amount.
For example, if you believe the price of crude oil will be above $70 in the next hour, you can buy a binary option contract with that condition. If your prediction turns out correct at expiry, your broker pays a predetermined return.
Binary options are prized for their simplicity and limited risk — you know your potential loss upfront.
Unlike regular trading where profit depends on how far the price moves, binary options offer an all-or-nothing payoff. This means whether the price moves a few cents or much more won’t affect your payout as long as the final condition is met.
This simplicity appeals to many, but it comes with trade-offs:
The profit potential is capped.
Requires precise timing to win trades.
Often shorter trade durations than traditional trading.
Another difference is that binary options often trade on a fixed expiry, like 5, 15, or 60 minutes, demanding quick decision-making rather than holding positions for days or weeks.
Binary options are not about predicting how much the price will change, just the direction and timing.
Understanding these differences is vital before using tools like TradingView for strategy and analysis tailored specifically to binary options trading.
Before diving into trades using TradingView, setting everything up properly can save you a bunch of headaches down the line. Getting the platform ready for binary options analysis means more than just logging in. It involves choosing the right tools, learning to navigate the interface, and knowing where to find the assets you want to trade. This setup phase is crucial because it lays the groundwork for making decisions tighter and quicker—something every binary options trader needs.
Starting with TradingView is straightforward. Head to the TradingView website and hit the "Sign Up" button. You'll be asked for basic info like your email and password, but you can also sign up using Google or Facebook for a quicker route. Once you've confirmed your email, you’re good to go.
Signing up isn't just a formality; it unlocks personalized features like saving your charts, setting alerts, and customizing watchlists, all of which are invaluable when trading binary options where timing and quick analysis are critical.
Once inside, the dashboard is your command center. On the left, you’ll find the toolbar loaded with drawing tools—like trend lines and Fibonacci retracements—perfect for spotting entry and exit points. The center of the screen hosts your chart; you can switch between different chart types and time frames here.
On the right-hand side, there's a panel for watchlists and alerts. Setting alerts lets you keep an eye on price movements without staring at the screen all day, especially useful if you're waiting for a particular asset to hit a strike price in binary options. The bottom area includes chat and news panels, giving you a pulse on market sentiment and breaking events.
Getting familiar here makes a huge difference. Think of it like learning the layout of a new city before heading out; knowing where everything is saves you time and effort.
Binary options traders can play across a wide range of assets on TradingView — from popular forex pairs like EUR/USD and GBP/JPY, to commodities such as gold and oil, and even major stocks including Apple and Tesla. This variety means you’re not stuck betting on just one market, which spreads your exposure and opens multiple trading opportunities.
Don’t overlook cryptocurrencies either. TradingView offers charts for Bitcoin, Ethereum, and others, though volatility here means you’ll want to tread carefully.
To find these assets, use the symbol search bar at the top-left corner. Simply type in the asset name or ticker symbol (e.g., "AAPL" for Apple). You can narrow down results by selecting the market category—like Forex, Stocks, Futures, or Crypto—from the dropdown.
You can also create a personalized watchlist by clicking the “+” icon, add your preferred assets, and monitor their price changes without toggling in and out of screens. Plus, filtering by volume, volatility, or recent news updates lets you zero in on instruments that suit your binary options strategy.
Remember, the right asset for binary options trading depends largely on your strategy and the time frame you're comfortable with. Setting up a tailor-made watchlist helps keep trading focused and efficient.
In short, organizing your account, unpacking the dashboard tools, and knowing how to find the right financial products—these steps are the backbone of effective TradingView usage for binary options. Without a proper setup, even the best analysis runs the risk of falling flat due to missed opportunities or cluttered workflows.
Charts are the heartbeat of trading analysis, especially when it comes to binary options where decisions often hinge on short-term price movements. TradingView’s charts provide traders with an intuitive, visual way to track market fluctuations and spot trading signals. This section breaks down how to pick the right chart type and time frame to boost your binary options game.
Candlestick charts are by far the most popular among binary options traders, and for good reason. Each candlestick shows open, close, high, and low prices in a clear visual format that tells a story about market sentiment during a specific time period. For example, a green candlestick might suggest buyers were in control, while a red one could indicate selling pressure. This detail helps you make quicker judgments on price action—essential in fast-moving markets like Forex or indices.
Line charts, on the other hand, draw a simple line connecting closing prices over a chosen interval. While they don’t give you the price range or intra-period dynamics, they’re useful for spotting long-term trends or smoothing out noisy data. If you want a bird’s eye view without distractions, a line chart can do the trick.
In practical terms, candlesticks suit traders who want rich detail for short to mid-term binary trades, while line charts can help in deciding overall market direction before drilling down.
Bar charts are kind of a middle ground. Like candlesticks, each bar shows open, close, high, and low prices but with a thinner, more minimalistic visual. Some traders find bar charts less cluttered and easier on the eyes, especially when handling multiple assets.
Bars let you quickly identify volatility because longer bars mean bigger price swings. This makes bar charts handy when you want to avoid binary options trades during choppy markets. For instance, spotting a cluster of tiny bars might suggest low volatility, ideal when trading range-bound assets.
Binary options trading often targets short bursts of profit, so selecting the right time frame is crucial. Short-term charts—1-minute, 5-minute, or 15-minute intervals—offer sharp snapshots perfect for trades lasting from 30 seconds to an hour. These show granular price moves to help you time entries and exits precisely.
Long-term charts like hourly or daily frames are less useful for quick binary trades but great for getting the bigger trend picture. For example, spotting a clear upward trend on a daily chart can help avoid betting against the market even if the 5-minute chart shows minor dips.
Think of it like scouting: use long-term charts to get the lay of the land and short-term charts to pick the exact spot to jump in.
Most traders find the 5-minute and 15-minute charts to be golden sweet spots, especially in Forex and commodity markets. For example, if you’re placing a binary call or put for 30 minutes, the 5-minute chart can reveal the immediate price movement and momentum.
For very short expiration times (like 60 seconds or 2 minutes), the 1-minute chart is best but requires a sharp eye and quick fingers. Longer expiration trades, such as 1 hour or more, benefit from 30-minute or hourly charts that smooth out the noise.
Always match the chart’s time frame to the lifespan of your binary option contract. Using mismatched intervals is like trying to drive a race car with fogged-up glasses—the signals get fuzzy.
In summary, understanding and using TradingView’s various chart types and time frames smartly can make or break your binary option trades. Candlestick charts with 5- to 15-minute intervals tend to provide the most actionable insights for most binary strategies, while bar and line charts help with trend confirmation and market overview. Adjust these tools to fit your style and the particular asset to stay ahead in this fast-paced trading arena.
Using technical indicators is essential for traders dealing with binary options. These indicators help cut through the noise of market fluctuations, providing signals that can guide entry and exit decisions. In binary trading, where outcomes hinge on price movement within short time frames, relying solely on visual chart reading can be risky. Indicators like moving averages, RSI, and Bollinger Bands provide objective insights and improve a trader’s ability to predict price behavior more reliably.
Integrating these indicators into your TradingView setup lets you respond faster to market moves and spot patterns that might be tough to detect with the naked eye alone. But it's not just about slapping on a bunch of indicators; understanding how each works and when to rely on them is the key to making better trades and managing risks effectively.
Moving averages smooth out past price data, making it easier to spot trends over time. They’re practical because they help identify whether an asset is generally moving up, down, or sideways. For binary options traders, using a short-term moving average like the 10-period MA combined with a longer-term one, such as the 50-period MA, can be a simple way to catch trend reversals or confirmations.
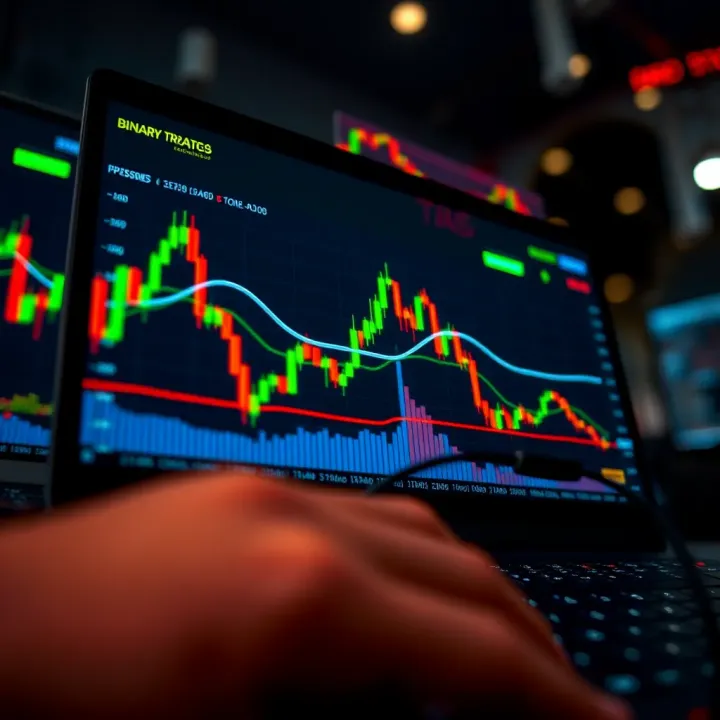
For example, when the 10-period MA crosses above the 50-period MA, it might signal an upward trend, prompting you to consider a "call" option. Conversely, a cross below could hint at a downward trend and suggest a "put" option. This crossover method works well with TradingView's customization and alert features to keep you in the loop without staring at the screen all day.
The RSI measures the speed and change of price movements on a scale from 0 to 100, showing whether an asset is overbought or oversold. Traders often focus on readings above 70 (overbought) or below 30 (oversold). In binary options, these signals can hint at potential reversals or continuations.
Let's say the RSI dips below 30 on an asset within a 5-minute chart on TradingView; this oversold condition might mean the price is due for a bounce, making a "call" option appealing. However, like any indicator, RSI isn't perfect—it can stay in overbought or oversold zones longer than expected, so it’s wise to pair it with other signals to improve accuracy.
Bollinger Bands plot two standard deviations away from a simple moving average, creating upper and lower bands that expand and contract with market volatility. When price hits the upper band, it might indicate overextension; hitting the lower band might signal undervaluation.
For binary options, if the price steadily bounces off the lower band and starts moving upward, it could be a signal to place a "call" option. On the other hand, touches or breaks of the upper band followed by a reversal might suggest a "put" option. Traders on TradingView can watch for these patterns and set alerts when price reaches these bands, making it easier to time trades appropriately.
A single indicator can give a false reading, but when multiple indicators agree, the chances improve for a successful trade. For instance, if the moving average crossover aligns with an RSI reading in the oversold zone and the price is near the lower Bollinger Band, this confluence strengthens the signal to take a "call" option.
Traders should look for overlapping cues rather than relying on just one. Confluence helps confirm trends or reversals and reduces random noise. In TradingView, you can overlay several indicators on one chart and customize combined alerts, which comes handy when spotting these multi-confirmation signals.
While it’s tempting to pile on indicators hoping for a crystal-clear picture, too many can cause confusion and even contradictory signals. This overload often leads to paralysis or poor judgment.
Stick to 2-3 complementary indicators at most—for example, a trend-following (moving average), a momentum (RSI), and a volatility indicator (Bollinger Bands). This balance supports clarity and quick decisions in binary options where timing is critical. Overcomplicating setups makes it harder to react swiftly, which can cost you money in fast-moving markets.
In essence, effective use of technical indicators relies on striking the right balance: enough information to confirm your bias but not so much that it muddies the water or delays your decisions.
By mastering these indicators and their combinations, traders can significantly sharpen their binary options strategy using TradingView's powerful tools.
Creating a solid trading strategy is the backbone of success in binary options, and TradingView offers powerful tools to help you build these strategies. Developing strategies here means more than just picking an indicator; it’s about combining analysis, timing, and discipline to make smarter trades. The platform’s interactive charts and customizable indicators let you see market conditions clearly, enabling you to craft approaches that suit your style and the specific dynamics of binary options.
By using TradingView, traders can experiment with various methods without risking real money, which is a big advantage. This practice helps in understanding how trends or patterns behave before putting capital on the line. For example, if you notice trading in currency pairs, identifying when a trend is strong or spotting a reversal can be critical — TradingView’s visual tools highlight these moments well.
Trend identification is basically spotting market momentum moving consistently up or down. This matters because trading binaries against the trend is like swimming upstream — it’s tough and usually loses. On TradingView, you can use simple moving averages, like the 20-day or 50-day SMA, to see if prices are generally climbing or falling. If the price stays above a moving average, it often signals an uptrend; below it might indicate a downtrend.
Look also for higher highs and higher lows in an uptrend — a clear sign prices are pushing upwards steadily. Conversely, lower highs and lower lows show a downtrend. Catching these early on can give you the edge to enter binary options that expire favorably because you’re riding the wave rather than fighting it.
Remember, trends don’t last forever, so always check the bigger picture alongside your chosen timeframe.
Trend lines are simply straight lines drawn along the consecutive lows in an uptrend or highs in a downtrend. Trend channels add a parallel line on the opposite side, creating a ‘track’ within which prices tend to bounce. These tools help traders visualize where price is likely to find support or resistance within a trend.
For example, if the price is approaching the lower trend line of an ascending channel, it could be a good signal to enter a "call" binary option since the price might bounce back up. Conversely, hitting the upper channel might hint at a pullback, suggesting a "put" option could pay off.
Plotting these lines on TradingView is straightforward with the built-in drawing tools. Regularly adjusting them keeps your strategy aligned with the market’s rhythm instead of blindly following outdated patterns.
Support and resistance zones are market shelves where price repeatedly stops falling or rising. When prices hit support, buyers tend to come in; resistance is where sellers hold the line. Frequent touching of these levels without breaking indicates a range-bound market.
TradingView lets you mark these levels on the charts visually, making it easier to decide when to enter a binary option predicting a bounce. For instance, if a currency pair like USD/PKR repeatedly bounces off the 160 support level, using a "call" option near this point might be a safer bet.
You can boost your analysis by watching candlestick patterns or volume spikes around these levels — such clues often confirm whether a support or resistance will hold.
Reversals pivot the market’s direction and spotting them early can turn the tide in your favor quickly. Classic reversal patterns include the double top, double bottom, head and shoulders, and engulfing candles. These are easier to identify using TradingView's chart zoom and timeframe adjustments.
For example, a double bottom pattern near a support zone suggests sellers tried twice but couldn't push the price down, hinting at a possible upward move. Entering a binary "call" option right after the pattern completes could yield a win.
TradingView’s alert system can be set up to notify you when certain candlestick formations appear, so you don’t miss crucial reversals. Combining these with volume indicators enhances confidence before executing trades.
By incorporating these strategies into your TradingView setup, you gain a practical edge. The platform’s flexibility lets you tailor approaches and react swiftly, which is exactly what binary options traders need to stay ahead.
Setting up alerts and notifications on TradingView is a big help for binary options traders trying to catch the right moments. Unlike just staring at charts all day, alerts let you relax a bit and still stay ready to act. Since binary options are all about timing — usually short-term moves — missing a price shift or indicator crossover can cost you real money. That's why customizing alerts helps traders not just react faster but also plan better, preventing them from being glued to the screen and making rushed or emotional choices.
Price alerts mean you tell TradingView to ping you the moment an asset hits a specific price, which is super useful for binary options trading. For example, if you're watching the EUR/USD pair and want to jump in when it hits 1.1200, you just set an alert for that price. When it triggers, you’ll get notified immediately — no need to stare at the charts 24/7. This helps capture potential entry opportunities exactly at levels you've analyzed, improving your chances to place timely trades.
One tip: choose price levels where past price action showed support or resistance. Say Bitcoin has bounced off $28,000 three times previously; setting an alert near this level gives you heads-up on a potential reversal or breakout.
Binary options rely heavily on precise timing. Early entry at the right price can make or break returns, while knowing when to exit protects your capital. Alerts come in handy here by notifying you before the price moves strongly in your favor or if it reverses against your bet.
For instance, you might set an alert just below a critical resistance level to enter a "put" option if the price fails to break past it. Similarly, an alert slightly below your strike price can remind you to exit early or avoid a losing trade. Alerts help avoid guesswork or emotional delays, making your entry and exit more disciplined.
Many traders base decisions on technical indicators like Moving Averages or RSI. When these indicators cross specific thresholds — like the 50-period MA crossing above the 200-period MA — it can signal a trend change. TradingView allows setting alerts for these exact moments, so you don’t miss out on signals crucial for binary options strategies.
For example, if you're using RSI to spot overbought or oversold conditions, you can set an alert to notify you when RSI crosses above 70 or dips below 30. This instant update can steer you toward calls or puts without having to track RSI constantly.
One pitfall of using alerts is going overboard and cluttering your phone or inbox with constant pings. To keep notifications useful instead of distracting, it helps to:
Limit alerts to the most critical price levels or indicators relevant to your current trades
Use custom messages in alerts to remind you why the alert matters
Schedule "quiet" times during less active trading hours
Group alerts by asset or strategy to avoid confusion
By managing notifications well, traders can stay sharp and responsive without feeling overwhelmed or tempted to ignore alerts altogether.
Well-tuned alerts on TradingView act like an extra set of eyes, catching moves that could slip past human monitoring — a real edge in binary options trading where seconds count.
In short, customizing alerts and notifications is a practical way to leverage TradingView’s power effectively for binary options. It helps maintain focus, enhance timing, and avoid fatigue — all key for trading smarter, not harder.
Integrating TradingView's powerful charting and analytical tools with actual binary options trading platforms is a vital step for traders. It bridges the gap between analysis and execution, allowing traders to make more informed and timely decisions. This integration isn't just about copying signals blindly; it's about using TradingView’s in-depth insights to fuel smarter trade entries and exits on platforms like IQ Option, RaceOption, or Pocket Option.
When you sync your analytical observations with real broker platforms, you tap into a more strategic approach rather than gambling on market swings. For instance, if a trend reversal is spotted on TradingView charts using RSI dips or candlestick patterns, acting swiftly on your binary platform can significantly improve your chances to capitalize on short-term price moves. Without this link, you might either miss out or enter late, hurting potential profits.
Placing trades based on TradingView analysis starts with a clear plan. Traders should watch for specific signals on TradingView—say, a MACD crossover or a Bollinger Bands squeeze—that align with their predefined trading strategy. For example, spotting a strong uptrend on a 5-minute candlestick chart combined with an RSI that’s climbing above 50 can signal a call option opportunity.
Once identified, head to your binary options platform and set your trade parameters accordingly—asset, strike price, expiry time, and investment amount. Precision here matters: picking the right expiry time (like 15 minutes for quick binary trades) to match the anticipated price movement is crucial. This coherent alignment between analysis and execution is what turns chart insights into real profits.
Managing risk alongside binary broker platforms is just as important as placing the trades. Even with solid analysis, the market can move unexpectedly, so setting clear loss limits helps protect your capital. Many binary platforms let you set stop-loss levels or reduce bet sizes—use these features wisely.
Additionally, employing a risk management technique such as the "1-2% rule"—risking only 1-2% of your trading capital per trade—can stave off big losses from a run of bad trades. Combining TradingView’s alert system with disciplined money management ensures you’re not caught off-guard. For instance, if an alert signals a potential reversal but your portfolio is already heavily exposed, it might be smarter to sit out instead of risking overtrading.
Data delays and platform compatibility present real hurdles. TradingView often provides free data streams, but these might be delayed by up to 15 minutes for some markets, which can be a problem for fast binary options where seconds count. Always verify if your TradingView subscription level offers real-time data for the assets you're trading.
Similarly, the binary broker platform you use might have slightly different price feeds or execution speeds, leading to mismatched conditions between TradingView charts and live trades. For example, you might see a bullish breakout on TradingView a moment before your broker updates its prices, potentially leading to premature trade entries.
Being aware of these issues, some traders prefer brokers recommended by TradingView communities or those with API integration options to sync live data. If not, it’s safer to include a small buffer or delay in interpreting signals, minimizing false entries.
Legal and regulatory aspects in Pakistan should never be overlooked. Binary options trading regulation is still evolving here, so traders must ensure their broker is licensed and compliant to avoid pitfalls. Using TradingView as an analytical tool does not exempt anyone from the jurisdictional rules concerning trading.
The Securities and Exchange Commission of Pakistan (SECP) has guidelines that may affect binary options and derivatives trading. Make sure to check if your chosen binary broker is internationally recognized and offers legal protection mechanisms. Trading with unauthorized platforms can lead to legal troubles or financial losses.
Always prioritize brokers and tools that align with local laws to keep your trading activity both safe and sustainable.
In summary, integrating TradingView with binary options platforms offers a clear pathway to better trading decisions but requires awareness of data limitations and local regulations. Maintaining this balance can give traders in Pakistan a much-needed edge in this fast-paced market.
Getting started with TradingView for binary options can feel like trying to learn a new language while running a marathon. This section lays down some ground rules to help newcomers avoid costly pitfalls and establish solid habits from the get-go. Practical tips aren’t just nice to have — they’re essential for building confidence and consistency in this fast-paced trading environment.
One of the biggest traps beginners fall into is overtrading. It’s tempting to jump into trade after trade, especially when the market is active, but this approach often backfires. Overtrading drains your capital and attention, leading to sloppy decisions and emotional burnout. For example, opening several losing binary options in quick succession because you’re chasing a loss only makes matters worse. Set a daily limit on the number of trades or the total amount you are willing to risk to keep this tendency in check.
Neglecting risk management is like building a house without a solid foundation. Without clear rules on how much you can afford to lose on each trade, you can quickly wipe out your account. Binary options, with their all-or-nothing payouts, demand strict discipline. Many beginners overlook this and put too much money on a single bet, which is a recipe for disaster. Use strategies like fixed percentage risk per trade, such as no more than 2%–3% of your trading capital, to protect yourself from sharp losses.
Paper trading on TradingView is a fantastic way to get your feet wet without risking real money. It lets you simulate buying and selling binary options based on live market data. This hands-on experience helps you understand how your analysis translates to real trading scenarios. For example, when testing a strategy based on the RSI indicator crossing below 30, paper trading allows you to see in real time how this plays out before committing real cash. Make it a habit to practice regularly, treating it as seriously as live trading.
Diving headfirst into complex strategies rarely pays off for beginners. Instead, break down your learning into manageable chunks. Start by mastering one indicator, like moving averages, then gradually combine it with another, such as Bollinger Bands. This step-by-step approach prevents overwhelm and lets you build confidence as you see small wins stack up. Remember, trading is a marathon, not a sprint — steady progress beats quick fixes every time.
Starting slow and steady with TradingView for binary options not only protects your capital but also sharpens your skills for long-term success. Avoid rushing, pay close attention to risk, and keep practicing smarter, not harder.
By following these tips, new traders can avoid many common mistakes and create a practice routine that sets them up for steady progress with TradingView tools and binary options trading.
In the world of binary options trading, risk management and money management act as your safety nets. Without these principles firmly in place, even the best analysis on TradingView can quickly unravel your account balance. Simply put, risk management is about controlling your potential losses, while money management focuses on the smart allocation of your capital to stay in the game longer. Both go hand-in-hand to help you avoid blowing your bankroll on a single bad trade or during a volatile market phase.
By incorporating these principles, you’re not just gambling on chance but making educated, calculated decisions. For example, a trader who sets daily loss limits and trades a fixed percentage of their capital per option is far likelier to weather losing streaks than someone who chases losses recklessly. This is especially important in binary options where the all-or-nothing payoff can quickly drain funds.
Setting daily and per-trade loss limits is like putting a cap on how much you’re willing to lose before stepping back. Say your total trading capital is $1000. A common rule is to risk no more than 1-2% of your capital on a single trade — that's $10 to $20 per binary option. On a daily basis, you might decide to stop trading once you've lost 5% of your capital ($50). These limits force discipline and keep emotions in check.
Without these boundaries, it’s easy to throw in reckless trades after a loss, trying to recover all at once. This often leads to losses piling up quickly. Think of it as a safety valve: when you hit your set limit, you take a break, analyze what’s going wrong, and avoid making emotional decisions.
Volatile markets can feel like a rollercoaster. Price swings are faster and more unpredictable, which can be tempting for quick profits but also a huge risk. Protecting your capital in such times means reducing your trade size or even sitting out when the noise gets too loud.
For example, if market news triggers sharp moves in forex pairs or commodities, it’s wise to pause or at least cut trade sizes to 0.5% of your capital instead of 1-2%. This approach helps you avoid getting caught on the wrong side of a sudden spike or drop. You can also use TradingView’s volatility indicators to spot these moments and adjust accordingly.
Protecting your capital is your top priority. Without it, no strategy, no matter how clever, can save you.
Discipline often separates the consistent traders from those who burn out fast. Sticking to your pre-planned strategy—even when the market tempts you to deviate—means trusting your analysis and rules. For instance, if your strategy says to enter a trade only when RSI crosses above 70 combined with a certain candle pattern, you don’t jump in just because you feel "today's different."
This consistency helps in refining your approach over time because you have reliable data from which to learn. Abandoning rules on a whim usually leads to random results and unnecessary losses.
Emotions like fear and greed can mess up even the clearest TradingView setups. Imagine losing a few trades in a row and then chasing those losses with bigger bets—this usually ends badly. Being aware of your emotional state and recognizing when it’s affecting your decision-making is key.
Some traders use simple tricks to avoid this. Taking breaks after a loss, setting fixed trading hours, or even having a checklist before each trade can all help keep emotions at bay. Remember, trading is not about chasing quick wins but about staying steady and focused for the long haul.
By combining strict risk limits with disciplined trading habits, you’ll protect your capital and create a solid foundation for consistent gains in binary options. It’s the no-nonsense, everyday approach that keeps traders from losing their shirts and helps them stay sharp over time.
Keeping tabs on how you perform with binary options trading is just as important as picking the right trades. Without evaluating your trades, you’re basically flying blind, missing chances to spot where you’re nailing it or where you're heading off course. TradingView gives some solid tools to help here, making it easier for traders in Pakistan and elsewhere to sharpen their edge and avoid repeating mistakes.
TradingView’s replay function is a nifty tool. It lets you rewind the market action and practice trading as if you were there in real time. This hands-on approach helps traders pinpoint what worked or went wrong without risking actual money. Say you’re unsure how a particular indicator performed during sudden price drops; simply rewind and watch the price action again to see how signals behaved.
The history feature also keeps a record of your past analyses and technical set-ups. Having this archive means you can review your trading calls and verify whether your decisions were on point or flawed. This historical feedback is invaluable—it turns your trading efforts into a learning loop.
No matter how good a platform is, nothing beats writing down your thoughts, emotions, and the reasons behind each trade. A trading journal acts as your personal coach, helping you reflect and recognize patterns in your own behavior. For example, you might notice you tend to rush trades after a win, leading to overconfidence and losses.
When writing your journal, be straightforward—jot down the setup, your plan, the outcome, and what you felt before and after the trade. Over time, this disciplined habit reveals how your mindset affects results and guides you to steady improvements.
Once you have data from your trades and notes from your journal, it’s time to break down what works and what doesn’t. Maybe you’re excellent at spotting reversals on EUR/USD but tend to miss trends in commodities like crude oil. By sorting your wins and losses by market type, time frame, or strategy, you build a clearer picture of your strong points and where you need more practice.
This self-awareness guides you to focus effort where it counts instead of spreading yourself thin.
Data alone isn’t magic until you use it to tweak your approach. For instance, if you notice that binary options trades based on RSI crossovers work well on 5-minute charts but fail on 1-minute charts, you should adapt your strategy accordingly. Perhaps limit RSI-based trades to longer intervals and find alternatives for quicker trades.
Continuous adjustment is part of smart trading. It’s not stubbornly sticking to a plan when the market says otherwise, but intelligently refining your tactics to fit real-world outcomes.
Keeping a sharp, honest eye on your performance—using both TradingView’s tools and your own notes—sets a foundation for long-term success. It’s a cycle of trade, review, learn, and adapt that separates consistent traders from the rest.
This approach isn’t just for pros; beginners can benefit hugely by integrating these habits into their routine from day one. The key is to stay patient and disciplined, because improving your trading performance is a steady climb, not a quick sprint.
Wrapping up, this section pulls together everything we've talked about, focusing on why these takeaways matter for your trading day-to-day. As you’ve seen, TradingView isn't just another charting tool—it’s a practical companion for binary options traders, whether you're just starting out or looking to sharpen your edge. The key here is understanding how to apply what you’ve learned effectively, without getting overwhelmed or falling for common pitfalls.
One practical benefit is that by using TradingView’s features thoughtfully, you can spot opportunities and risks more clearly. For example, setting alerts on key price levels can help you avoid missing trade entries or exits, especially when the market moves fast. But equally important is knowing your limits—don’t let flashy indicators or alerts push you into overtrading. That’s where discipline and a clear plan come in.
Think of this conclusion as your checklist before moving forward—reflect on your current approach, tweak your strategies based on TradingView insights, and commit to ongoing learning. It’s like cooking a familiar recipe; sometimes you add a pinch of this or that to improve the taste. The next steps guide you toward that incremental improvement, making sure you’re not just working hard but working smart.
Key takeaways: To put it simply, TradingView gives you a front-row seat to market action with real-time charts, customizable indicators, and alert tools designed with traders’ needs in mind. What stands out about TradingView is its user-friendly layout combined with powerful functionality—ideal for binary options where timing and precision matter a lot.
For instance, the ability to overlay indicators like Moving Averages and RSI at the same time helps confirm trade signals, reducing guesswork. Plus, TradingView’s replay feature lets you go back and analyze past market conditions, which is a real lifesaver for refining your strategies. This hands-on practice can save you from costly mistakes later.
How TradingView supports better trading decisions: By centralizing your analysis tools and offering a wide range of data at your fingertips, TradingView helps cut down analysis time and increase confidence in your trades. The platform’s alert setup means you’re not glued to the screen but stay in the know, which is crucial when trading binary options with short expiry times.
Moreover, the global community's shared ideas and scripts offer fresh perspectives or alternative strategies that you might not have considered. This dynamic aspect helps you stay adaptive in changing markets, turning raw data into actionable knowledge.
Recommended tutorials and communities: To keep your skills growing, tap into platforms like BabyPips and Investopedia for beginner to intermediate tutorials tailored to options trading. On top of that, TradingView’s own public scripts and social feed are treasure troves where traders share setups and ideas openly.
Joining communities such as Reddit’s r/Daytrading or specialized Facebook groups focused on binary options allows you to peek at real-life trading discussions, ask questions, and learn from others’ experiences. These spaces can offer practical tips you won’t find in textbooks.
Building long-term skills in binary options trading: Real growth happens over time, not overnight. Building resilience involves sticking to a trading journal, reviewing both wins and losses, and not rushing into bigger bets until you’re consistently profitable. Consider this like learning to drive; you start in quiet neighborhood streets before hitting the highway.
Keep experimenting with different indicator combos on TradingView and test them with paper trading before committing actual money. Regularly updating your strategy based on what you learned from your trade logs will sharpen your decision-making muscle. And always, remember that managing your emotions and sticking to a plan is as important as the technical stuff.
Patience and persistence beat speed when it comes to mastering binary options trading with TradingView. Take it step by step, use the platform’s tools smartly, and keep learning from each trade.
By following these steps and making use of the resources mentioned, you’ll build both confidence and competence in your trading journey. Keep at it, and the results will follow.
📊 Learn how to use TradingView for binary options trading in Pakistan 🇵🇰. Get practical tips on charts, indicators, & market analysis to improve your trades!

📊 Learn how to connect TradingView charts with Deriv seamlessly! Step-by-step setup guides and smart tips for traders in Pakistan to improve trade analysis and execution.

📊 Explore TradingView's powerful tools for charting, technical analysis, and community features in Pakistan. Learn tips to optimize your trading strategy!
📊 Learn how to combine TradingView's charts with Binary.com for smarter trades in Pakistan 🇵🇰. Get setup tips, indicator guides, & risk management advice! 📈
Based on 14 reviews