

TradingView Guide for Pakistani Traders
Explore TradingView.com for Pakistani traders 🇵🇰! Learn to set up accounts, use advanced charts 📊, and join a vibrant trading community for smarter decisions 🌐.
Edited By
Maxwell Reed
TradingView is rapidly gaining popularity among traders and investors, especially in Pakistan, due to its versatile approach to market analysis and trading. Whether you're simply watching the market or actively trading stocks, forex, or cryptocurrencies, understanding how to use TradingView can seriously beef up your strategy.
The platform offers everything from real-time data and customizable charts to a buzzing community where traders exchange ideas and strategies. This means you’re not just looking at numbers, but also learning from how others interpret them.
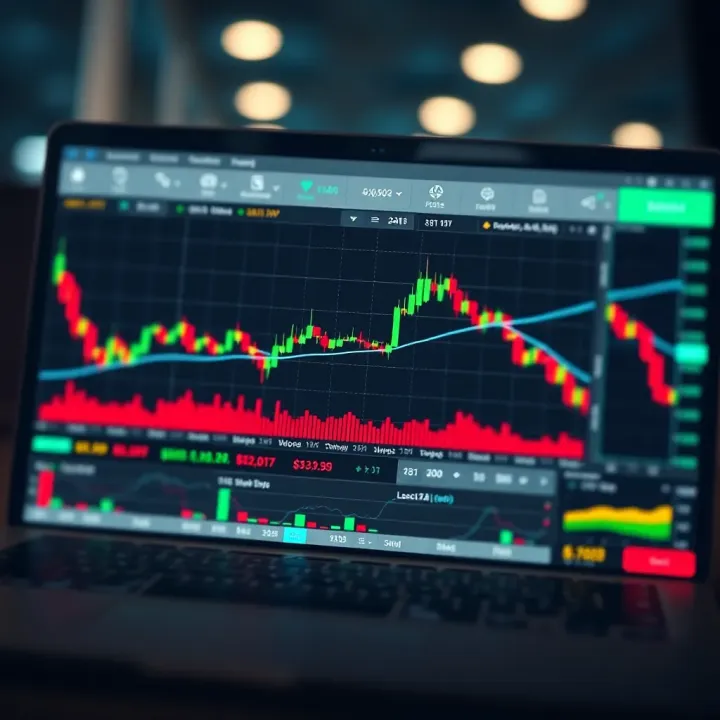
In this guide, we'll walk through the nuts and bolts of TradingView, covering its core features, how traders use them on a daily basis, and tips to make the most out of the platform. Whether you're new to trading or someone who's been around the block, this article aims to make TradingView work better for you.
TradingView isn’t just a tool, it's like having a trading buddy who’s glued to the market 24/7 — helping you spot opportunities and avoid pitfalls.
We'll touch on:
Key features that set TradingView apart, like advanced charting and custom indicators.
How to tailor charts to fit your trading style and market.
Using technical analysis tools without overcomplicating things.
Participating in the TradingView community to pick up fresh ideas.
Practical advice for traders in Pakistan navigating local and global markets.
By the end, you'll have a solid grasp on using TradingView effectively, enabling smarter decisions and improving your edge on the market floor.
TradingView stands out as a go-to platform for traders who want easy access to real-time market data and powerful charting tools without the hassle of complicated setups. Its user-friendly interface and diverse features make it a practical choice for both beginners and seasoned traders. In Pakistan, where access to diverse markets can be tricky, TradingView opens doors to a broad range of trading opportunities, which many other platforms don't readily provide.
This section lays the foundation for understanding why TradingView matters so much. It’s not just about pretty charts — it’s about how these tools can give traders the edge to make smarter decisions. Whether you trade stocks, forex, or crypto, grasping how TradingView fits into the trading scene will set you up for smoother market analysis and better-informed trades.
TradingView is designed primarily to serve traders and investors who need quick, accurate visual insights into market trends. It caters to a wide spectrum—from day traders scanning minute-by-minute charts to long-term investors watching weekly or monthly trends. Imagine a tool that meets the needs of someone just getting started with trading and also appeals to professional analysts looking to share ideas with a community. That's the kind of versatility TradingView offers.
The platform supports users who want to carry out technical analysis with tools like indicators, overlays, and drawing utilities. It’s also a hub for sharing strategies, meaning beginners can learn by seeing how pros analyze charts. This mix makes TradingView not just a tool but a trading companion.
One major advantage TradingView offers is its broad market coverage. You don’t need separate apps for forex, stocks, cryptocurrencies, or commodities—all of these are housed under one roof. Pakistani traders, for example, can track US stocks, local Pakistan Stock Exchange (PSX) shares, crypto pairs like BTC/USD, and commodities like gold or oil simultaneously.
This range helps traders diversify without jumping through hoops to get different market data. For someone focused on emerging markets or niche sectors, having all these options readily available can be a real time-saver and exposure booster.
For many traders in Pakistan, limited access to international trading platforms or delayed local data has been a hurdle. TradingView's cloud-based delivery means data comes fast and often more updated than local providers can supply. It provides a bridge to international markets that Pakistani brokers might not cover extensively.
This means a trader in Karachi can watch the NASDAQ or London Stock Exchange not just during their opening hours but almost in real time. This global window lets traders react quickly to events—like earnings releases or geopolitical developments—impacting their portfolios.
The ability to access both local and international markets from one place removes a major barrier faced by Pakistani traders, leveling the playing field somewhat with their counterparts abroad.
TradingView's cloud backbone means users never lose their work—they can save chart layouts, settings, and watchlists online and access them from any device. Unlike traditional software that ties your data to one PC, here you might check a chart on your laptop in the morning and then pull up the same setup on your phone during a commute.
Also, cloud-based platforms generally require less maintenance—no installs, no manual updates. This simplicity is a plus in fast-moving markets where every second counts and delays can cost real money.
In addition, TradingView handles the heavy lifting of rendering charts remotely, so even modest computers or mobile devices run smoothly. For Pakistani traders who might not have top-tier gadgets, this is a significant advantage.
By getting a solid grip on these basics, traders are better positioned to explore the platform’s deeper features. Understanding who TradingView is for and why it’s especially useful in Pakistan sets the stage for making the most of this popular trading tool.
Getting started is often the toughest step with any complex platform, and TradingView is no different. However, this initial phase is what sets the foundation for everything you want to achieve on TradingView—whether it's tracking the Karachi Stock Exchange, analyzing forex, or diving into cryptocurrencies. Grasping the basics early saves you head-scratching moments later. Plus, knowing how to navigate TradingView efficiently means you can focus more on market moves than fumbling with settings.
Creating an account on TradingView is straightforward and quick, making it accessible even for those who are not tech-savvy. Start by providing a valid email address, or you can use your Google or Facebook accounts to speed things up. After verification via email, you’re set to dive into the platform.
The signup gives you access to various user levels—from free accounts up to premium ones offering extended features. For most traders in Pakistan just beginning, the free tier with real-time data on key markets like forex and some indices is sufficient. Remember, having an account means your settings, watchlists, and layouts stay saved in the cloud, accessible from any device without reconfiguration.
Once logged in, the first thing you’ll notice is the TradingView dashboard, a command center that packs a lot into a single screen.
Chart Area: This is where most of the action happens. You’ll view real-time charts here, with the ability to add indicators and drawing tools at your fingertips.
Watchlist: Conveniently placed on the side, your watchlist lets you monitor multiple stocks, currency pairs, or crypto assets simultaneously. For instance, you can keep an eye on PSX’s indices alongside USD/PKR rates.
Search Bar: Quickly find any instrument across markets worldwide without breaking a sweat.
Market Overview: If you want a quick snapshot of how global financial markets are performing, this widget keeps you posted.
Getting familiar with these parts makes your trading workflow smoother—think of it as organizing your desk so everything is within reach.
The choice of chart type can heavily influence how you interpret market data. TradingView offers a variety of chart styles:
Candlestick Charts: The classic favorite for most traders. It visually shows the open, high, low, and close prices, making it easier to read market sentiment at a glance.
Bar Charts: Less flashy than candles but provide similar data. Some traders prefer this for its simplicity.
Line Charts: These connect closing prices with a continuous line, good for spotting long-term trends.
Imagine you’re analyzing Pakistan’s telecom stocks; candlesticks would let you see buying pressure or selling spikes clearly, helping you time your trades better.
Customizing your layout isn’t just about making things look pretty—it’s about building a workspace that fits your trading style like a glove. TradingView lets you save multiple chart layouts, so you don’t need to rebuild your setup every morning.
You might create different layouts for intraday trading and long-term investing. For example, one layout could have short time frames like 5-minute and 15-minute charts with volume indicators for quick trade decisions. Another could focus on weekly and monthly views with moving averages for deeper analysis.
Saving these layouts lets you switch contexts effortlessly without losing track of your tools and settings. It’s like having dedicated desks for different tasks without clutter.
Starting right with TradingView is a smart investment of your time—making sure you’re comfortable with the basics speeds up your learning curve and helps avoid costly mistakes.
By setting up your account properly and familiarizing yourself with the dashboard and chart basics, you’re laying the groundwork for better market analysis and sharper trading decisions.
Understanding the charting tools on TradingView is essential for any trader aiming to make well-informed decisions. The platform's diverse chart options and time frames provide various lenses to analyze market movements, helping traders adapt to different trading styles and market conditions. This section sheds light on these tools to give you a firm grip on how to read and interpret market behaviour more effectively.
Candlestick charts are arguably the most popular among traders due to the rich information they provide about price action within each period. Each candlestick shows open, high, low, and close prices, forming patterns that can hint at the next move. For instance, a long lower wick could indicate buying pressure, signaling a potential rise. Bar charts display similar information but with vertical lines and small horizontal ticks illustrating opening and closing points, offering a slightly different visual take. In contrast, line charts simplify things by connecting closing prices over time, useful when you want a clean and quick view to identify trends without distractions.
Heikin Ashi charts adjust the traditional candlestick approach by averaging price data, filtering out noise, and smoothing out trends. This can be very helpful when trying to spot the overall market direction without getting bogged down by every little spike or dip. On the other hand, Renko charts focus purely on price movement, ignoring time and volume. The price moves are highlighted by bricks that fall only when the market moves a set amount. This makes Renko ideal for traders wanting to spot clear support, resistance levels, and breakouts without the usual jitters of time-based charts.
The choice of time frame can radically change your perspective on the market. Intraday charts, like the 5-minute or 15-minute intervals, provide detailed insight ideal for day traders looking to capitalize on quick price swings. For example, scalping opportunities often depend on these quick, small-time frames. Meanwhile, daily or weekly charts suit swing traders and investors seeking to identify major trend shifts or hold positions over weeks and months. Recognizing the difference can save you from false signals that arise when short-term noise clouds the broader picture.
Selecting the right time frame hinges largely on your trading style and objectives. Day traders benefit from short-term charts that let them exploit small, rapid moves. In contrast, position traders rely on longer time frames to minimize stress and avoid overtrading. For example, if you focus on the Pakistan Stock Exchange but also peek at international markets, you might use a mix — quick intraday charts for Pakistani stocks and daily or weekly ones for global indices, balancing responsiveness with big-picture insight.
Getting comfortable with different charts and time frames isn’t a one-day thing. Spend time experimenting on TradingView, noting how price reacts under various conditions. This way, you can tailor your approach to what fits your trading style and the markets you follow.
By breaking down these charting options and time frames, you can better interpret market movements and boost the accuracy of your trading calls. TradingView’s flexibility lets you combine these tools in ways that suit your strategy, making it a strong asset for traders across Pakistan and beyond.
Technical indicators form the backbone of decision-making on TradingView. These tools help traders in Pakistan and worldwide read price movements more clearly and pinpoint potential entry and exit points. Without them, chart analysis would largely rely on guesswork rather than data-backed insights. Indicators can show trends, momentum, and market conditions, turning raw price data into actionable signals.
Besides improving accuracy, indicators save traders time by highlighting key patterns automatically. For example, instead of scanning hours of candlestick data, an RSI might quickly signal when a stock is overbought or oversold. Knowing which indicators to use and when to use them can sharpen your trading game considerably.
Moving averages smooth out price fluctuations to expose the underlying trend. The two common types are the Simple Moving Average (SMA) and the Exponential Moving Average (EMA). SMA takes the average price over a period, while EMA gives more weight to recent prices, making it more responsive.
In practice, traders watch for crossovers—like when a short-term MA crosses above a long-term MA, signaling a potential buy. Say the 50-day EMA crosses above the 200-day SMA; many traders interpret this as a bullish sign. On TradingView, you can overlay moving averages on any chart and adjust the period to match your strategy, whether you’re day trading or looking long term.
MACD is a momentum indicator combining aspects of moving averages to show trend strength and direction. It calculates the difference between two EMAs and plots this as a line. A signal line, which is an EMA of the MACD line itself, helps spot potential reversal points.
When the MACD line crosses above the signal line, it may indicate upward momentum, urging you to consider buying. Conversely, a crossover below signals a downward move. On TradingView, the MACD tool comes with histogram bars that visually represent the distance between the two lines, making it easier to notice shifts quickly.
RSI measures the speed and change of price movements to identify overbought or oversold conditions, usually on a scale from 0 to 100. An RSI above 70 suggests that an asset might be overbought and prone to a pullback, while an RSI below 30 indicates it could be oversold and due for a bounce.
Traders commonly use RSI to time reversals or confirm other technical signals. For example, if a stock is in an uptrend but the RSI drops below 30, it might be a good buy opportunity. TradingView allows you to customize the RSI period, often defaulted at 14, to suit your trading speed and preferences.

One indiidicator rarely gives the full picture. By combining several, you can cross-verify signals and reduce false alarms. For instance, you might use RSI to spot overbought conditions while checking MACD for momentum confirmation.
On TradingView, adding multiple indicators is straightforward—just click on the indicator button and select as many tools you want. It’s best to avoid cluttering the chart with too many, though; focus on a handful that complement each other. For example, pairing a moving average with RSI and MACD is a classic combo for balanced trend and momentum analysis.
Not all indicators should use default settings. Tweaking parameters lets you tailor indicators to fit different markets or timeframes. For example, in fast-moving intraday trading, a shorter moving average period (like 9 or 12) captures trends faster.
On TradingView, you can easily change periods, types, and other settings in the indicator’s properties. This flexibility lets traders in Pakistan adapt to local stock and forex markets, which might behave quite differently from U.S. or European markets. One common mistake is ignoring customization, which can lead to misleading signals. So, always test and adjust to find the sweet spot for your style.
Using technical indicators smartly on TradingView can drastically cut down guesswork and enhance your market timing, but remember – they should support your strategy, not replace your judgment.
Drawing tools and annotations are like the sketchpad for traders—helping you visualize trends, key levels, and potential turning points on your charts. They transform raw market data into actionable insights, making your analysis clearer and easier to follow. This part of TradingView is invaluable for traders who want to organize their thoughts or track ideas over time.
When you’re watching charts, drawing tools let you mark important price points or patterns without cluttering your view. Annotations, on the other hand, serve as your quick memos or reminders right on the chart. Together, they sharpen your ability to spot opportunities or warning signals, especially in fast-moving markets like Pakistan’s stock exchanges or international markets accessed through TradingView.
Trendlines are fundamental for identifying the direction that a stock or asset is moving over time. Just draw a straight line connecting two or more significant price points—usually highs or lows—and you get a visual path showing whether the price is generally drifting up, down, or sideways. For example, if you spot an uptrend in Pakistan’s KSE-100 index by connecting the rising lows, it signals that buyers are mostly in control, which helps you decide when to enter or hold a trade.
The secret with trendlines lies in their simplicity. They might not answer all questions but can reveal when momentum is fading or when a breakout is likely. TradingView makes it easy to adjust these lines and ensures they snap to price points for accuracy.
Using Fibonacci retracements helps traders spot potential support or resistance areas by measuring how far a price pulls back after a move. This tool is especially handy after sharp market swings because markets often retrace a portion of that move before continuing.
Picture a recent rally in a commodity like crude oil; by marking the swing high and low, Fibonacci levels can highlight where price might stall or bounce. Common retracement levels are 38.2%, 50%, and 61.8%. Traders watching these can plan strategies around these zones, for example, by placing stop-loss orders just beyond these levels to manage risk.
Support and resistance zones are the bread and butter for most traders. Support refers to a price level where buying interest is strong enough to prevent the price from falling further, while resistance is the opposite—where selling pressure caps the price’s rise.
On TradingView, you’ll often draw horizontal lines or rectangles to mark these zones. For instance, in Pakistan’s PSX, if a stock repeatedly stalls near PKR 150 and bounces upward, that’s support. Pinpointing these levels helps you gauge entry and exit points. It keeps decision-making practical: buy near support, sell or tighten stops near resistance.
Ever had an idea scribbled somewhere that you forgot later? TradingView solves this by letting you add notes directly onto your charts. It’s not just for reminders either; you can jot down your reasoning for a trade, important news events, or market conditions affecting the price.
For example, if there’s an earnings announcement expected for a Pakistani company, you can add a note near the date, so you remember to watch for volatility. Notes keep your analysis transparent and help maintain discipline in your trading routine.
What good is marking up your chart if it disappears once you log off? Luckily, TradingView saves all your annotations so that they’re ready whenever you log back in. This feature is key to tracking how your predictions pan out over time or reviewing past trades to learn from mistakes.
For instance, after applying trendlines and notes on a currency pair like USD/PKR, you can come back later to see if those levels held or broke. Saving annotations builds a personal trading journal right into your charting platform—no extra effort needed.
Drawing tools and annotations aren't just decorative; they're practical extensions of your trading brain, helping you think clearly and act decisively in unpredictable markets.
With TradingView's extensive suite of drawing tools and easy annotation features, traders can bring logic and order to price chaos, making their market reads and decisions all the more reliable.
TradingView isn’t just a charting tool or a platform for tracking markets; it’s also a lively community where traders exchange ideas, strategies, and insights. This social aspect is especially valuable for traders in Pakistan, where direct access to some sophisticated market information can be limited. By tapping into TradingView’s social features, you can expand your perspective, learn from experienced analysts, and sharpen your own trading decisions. The platform offers straightforward ways to follow others' work and to share your own, creating a dynamic learning environment.
One of TradingView's strengths lies in its community-driven content. Discovering and following analysts who share charts and ideas relevant to your trading style is quite simple. Use the platform’s search function to find experts by keywords, markets, or trading instruments. For instance, if you’re interested in the Karachi Stock Exchange, you can look up tags or streams focused on KSE-listed companies and follow those analysts.
Following someone means their shared charts and strategies will appear in your feed, keeping you updated on new insights. It’s like having a personal market briefing from seasoned pros without paying for expensive research. Doing this regularly builds a pool of diverse opinions that can help you spot trends or risks early.
Following other traders not only saves time but also introduces you to fresh market views, helping avoid tunnel vision.
The benefits of accessing shared charts and strategies go beyond education. Shared charts often include annotated setups with entry, exit points, and rationale, allowing you to understand the reasoning behind trades. This firsthand look at thought processes can be a practical way to develop your own strategy or adapt existing ones.
Additionally, watching how others react to market moves can teach you about risk management and emotional control. For example, a well-followed trader might post a setup on the Pakistan rupee's behavior against the dollar, explaining why they expect a breakout. Observing their real-time annotations and follow-ups gives you insight into responsive trading.
Don’t just be a spectator - TradingView encourages you to publish your own analysis too. Sharing your charts helps reinforce your learning, keeps a record of your ideas, and invites constructive dialogue. To publish your analysis, first create a detailed chart with the indicators and drawings you find important. Then click the “Publish” button, add a clear title, a description that covers your thought process, and any relevant tags.
Including screenshots and notes makes the post more understandable. Be honest about risks and levels where setups could fail. This builds credibility and trust within the community.
Posting your analysis isn’t about showing off; it’s about getting feedback and refining your approach over time.
Gaining feedback is one of the biggest advantages when you share your ideas. Other community members might spot something you missed or suggest alternative scenarios. This exchange can be especially beneficial for traders learning the ropes or testing new methods. Plus, interacting with experienced analysts fosters connections that can lead to mentorship or collaboration.
Regular participation in TradingView’s social features can create a supportive network that enhances your trading skills. It turns the solitary task of trading into a more interactive and well-rounded experience, which is invaluable in a market as unpredictable as Pakistan’s.
In summary, engaging with TradingView’s community features gives you access to shared knowledge, fresh perspectives, and constructive feedback—three key ingredients for growth as a trader.
Alerts and notifications are the unsung heroes of efficient trading on TradingView. They keep traders in Pakistan and elsewhere in the loop without needing to stay glued to the screen all day. Essentially, these features allow you to get instant updates when certain price levels are hit or when indicators show specific signals. This flexibility helps you catch opportunities or cut losses before things go south.
Setting up alerts means you can focus on other tasks, trust TradingView to monitor the market on your behalf, and only jump in when your predefined criteria are met. Whether you’re day trading or swing trading, alerts become your eyes and ears, saving you significant time and effort.
One of the strong points of TradingView is how granular you can get with your alerts. You’re not limited to just price levels; you can set alerts based on indicators and even your own drawings like trendlines or support/resistance levels. For example, if you want to know every time the RSI crosses above 70, signaling an overbought condition, it’s easy to set up a custom indicator alert for that. Similarly, for price alerts, you can choose to be notified when a stock—or forex pair like USD/PKR—reaches a specific price.
You can pin alerts to your charts with drawings too. Say you’ve drawn a Fibonacci retracement and want to be alerted every time the price approaches a key retracement zone. Setting a drawing alert saves you from having to monitor that area manually.
These alerts can trigger notifications via pop-ups, emails, or even SMS, depending on your TradingView plan, so you won’t miss a beat whether you’re on your phone or at your desk.
Once you’ve got your alerts set up, there comes the need to adjust or refine them as market conditions shift. Modifying alert conditions on TradingView is a straightforward process. You might start with a simple price alert but later tweak it to trigger only when the price crosses from below, ignoring any movements from the other direction. This refinement cuts down on false alerts and helps you focus on relevant signals.
TradingView’s alert management also gives you a history log where you can see a record of past alerts. This feature is useful to review missed opportunities or understand how your alerts have been performing over time. For example, if you noticed an alert was triggering too often or not at all, you can go back to the history and adjust the alert settings accordingly.
Notifications are delivered promptly through the app, emails, or SMS, depending on your preference and subscription level. Managing these options lets you avoid alert fatigue—getting too many ping notifications can be distracting, so you pick what’s important.
Effective use of alerts on TradingView allows traders to act swiftly without the need to watch charts 24/7, reducing stress and improving trading discipline.
In short, custom alerts and their flexible management make TradingView a practical tool that fits into your lifestyle, helping you stay on top of market movements even when life gets busy.
Integrating TradingView with brokers and other platforms adds a powerful layer of convenience and efficiency to your trading routine. Rather than toggling between separate applications, you can manage analysis and execution all within one ecosystem. This integration cuts down on missed opportunities and ensures your strategies are acted upon promptly. For traders in Pakistan, where local brokerage platforms might lack sophisticated charting or alert systems, TradingView’s ability to connect directly to brokers opens up access to global markets with advanced tools at their fingertips.
Linking your brokerage account with TradingView lets you trade directly from charts without jumping through hoops. It’s not just about convenience — it helps streamline your workflow and minimizes the risk of errors that come from manual data input. Platforms like Interactive Brokers, OANDA, FOREX.com, and Alpaca are among the brokers supported by TradingView, giving access across multiple asset classes.
How to link brokerage accounts: The process typically involves navigating to the Trading Panel inside TradingView, selecting your broker, and then logging in with your brokerage credentials. It’s usually a simple OAuth process similar to logging into your email through a third-party app. After linking, you can place buy or sell orders, set stop losses, or modify trades directly from TradingView’s interface.
Many Pakistani traders favor brokers like Interactive Brokers due to its broad market access, including American and European stocks, futures, and forex. Once connected, you can monitor your positions and balances in real-time alongside your charts.
Markets supported through brokers: Connectivity varies by broker but generally covers forex, stocks, futures, cryptocurrencies, and CFDs. For example, OANDA focuses mostly on forex and CFDs, while Interactive Brokers offers a wider variety, including options and bonds. Knowing what your broker supports helps tailor your TradingView setup to the markets you trade, avoiding any unexpected limitations.
Start small when linking your account to ensure everything syncs properly. Test by placing small trades and double-checking your portfolio updates accordingly before scaling up.
For those aiming to add automation, TradingView’s compatibility with trading bots and APIs opens up new possibilities. This setup moves beyond manual trades to programmatically executing strategies based on predefined signals and alerts.
Automation possibilities: Trading bots can use alerts generated by TradingView’s indicators to automatically execute trades without you having to lift a finger. For instance, a bot could place a buy order when the RSI dips below 30 or a moving average crossover signals an entry. This is especially useful for traders who want to act quickly on intraday signals or test strategies around the clock without constant monitoring.
Popular third-party automation services like 3Commas, AutoView, and Zignaly sync with TradingView alerts to trigger trades on supported exchanges, notably in crypto markets. While full automation requires careful testing to avoid costly errors, it can save time and remove emotional biases.
Third-party integrations: Beyond bots, TradingView supports a range of API-based tools for portfolio management, backtesting, and custom alerts. For example, users can connect with Excel or Python scripts to download historical data or implement custom scanning tools. For traders in Pakistan, who might rely on local data for stocks and want to analyze alongside global markets, this versatility helps bridge data sources.
Integrations also include news aggregators and sentiment analysis tools, which combine with TradingView’s data for a richer decision-making process. Being able to funnel multiple streams of info into one interface means you don’t have to hunt around multiple platforms.
Automation and integration with third-party tools require caution — remember to backtest strategies and monitor executions closely, as even the best systems can misfire without proper oversight.
With brokers linked directly and access to automation integrations, TradingView transforms from a charting platform to a trading hub, giving traders in Pakistan an edge in managing their investments effectively and efficiently.
Using TradingView across different devices, especially mobile and desktop, plays a vital role for traders in Pakistan. Markets don’t wait, and having the flexibility to check charts, set alerts, or tweak strategies on the go can make a big difference. Both mobile apps and desktop/web versions offer valuable tools, but knowing their strengths and limitations helps traders get the most out of the platform.
TradingView's web version, accessed through a desktop or laptop, is packed with the full range of charting tools, extensive drawing features, and custom indicators. This makes it perfect for deep analysis or when you're juggling multiple charts. Meanwhile, the mobile app is designed for convenience and quick checks — it covers most chart types and indicators but may lack some advanced tools like complex strategy testing or screen recording.
For example, a day trader in Karachi might use the desktop version during market hours to analyze multiple stocks with detailed indicators. Later, while commuting in Lahore, the mobile app allows quick rechecks and alerts management without missing a beat.
One drawback for both versions is that TradingView requires an internet connection for real-time data and charts. While the desktop can handle some cached views if you lose connection briefly, the mobile app does not support offline use for chart updates or alerts. This means traders need to plan ahead, especially when spotting price action or market trends out of Wi-Fi or data coverage.
Keeping this in mind, it's wise to sync your watchlists or export necessary data beforehand. This small step can save headaches if you suddenly find yourself offline during critical market moments.
To make the most of TradingView on your phone, customize the layout to show only essential charts or indicators. Smaller screens mean clutter can hinder quick decision-making. Enable push notifications for alerts so you don't have to keep the app open all the time.
Also, pairing your phone with a trusted power bank prevents losing power during crucial times. Using a stylus or larger screen device like an iPad can improve accuracy when drawing trendlines or marking support levels.
On desktop, employing multiple monitors significantly boosts productivity. For instance, a trader in Islamabad might dedicate one screen for live charts, another for news feeds like Reuters or Bloomberg, and a third for order execution platforms.
This setup allows monitoring of several markets or timeframes simultaneously, reducing the need to toggle between tabs. TradingView's ability to sync layouts across screens helps maintain consistent analysis across all devices.
Multi-screen setups can turn what once felt like a hectic juggling act into smooth, coordinated workflow — especially during fast-moving market sessions.
In summary, understanding how to tailor TradingView's mobile and desktop versions to your trading style and device capabilities yields better market insights and quicker actions. Whether you’re checking positions during a tea break or analyzing setups at your desk, the right approach ensures you stay connected and informed.
Getting the most out of TradingView means more than just knowing how to read charts or toss on a few indicators. It’s about smartly organizing your workspace and leveraging the platform’s tools to shave off wasted time and make faster, sharper trading decisions. This section unwraps some straightforward, practical tips that help streamline how you manage your watchlists, portfolios, templates, and shortcuts. These are crucial especially for traders in Pakistan who deal with multiple markets and limited time.
Watchlists are your quick-access roster of stocks, forex pairs, or cryptocurrencies you keep an eye on regularly. Setting up watchlists in TradingView is simple but powerful—because it lets you monitor price moves across different assets without jumping between charts. For example, if you’re trading the Pakistan Stock Exchange alongside US tech stocks, you can keep both groups separate yet instantly accessible.
To create a watchlist, just click on the left sidebar panel, hit the "+" to add a list, and name it something meaningful like "Pak Tech" or "Forex Targets." Add symbols one by one or import them if you have the ticker codes handy. This focused view saves you from hunting down instruments in the heat of trading hours.
Having your portfolio tracked right inside TradingView removes the hassle of managing separate spreadsheets or third-party apps. The platform allows you to enter your positions, including entry price, quantity, and fees, then automatically shows unrealized gains, overall value, and performance trends.
This real-time view gives you a clear picture of where you stand at any moment without manual calculations. It’s especially handy during volatile sessions where quick decisions matter—say, if your holding in a local stock dips sharply while a global index spikes, you can instantly spot the imbalance and adjust accordingly.
Keeping all your key instruments and portfolio data in one place boosts your response time and reduces mistakes.
Manually setting up indicators, time frames, and drawing tools for every chart is a chore that eats into valuable trading time. That’s where chart templates come in handy—they allow you to save a pre-configured chart setup and apply it instantly across any asset.
For example, if you rely on a combination of RSI and MACD on a 15-minute chart for intraday trades, save that setup as a template named "Quick Day Trade." The next time you pull up a new instrument, you just load the template instead of applying everything from scratch.
This disciplined approach not only speeds up analysis but also helps maintain consistency in how you view markets, avoiding the common pitfall of changing your indicator mix impulsively.
TradingView supports a large array of keyboard shortcuts that can seriously speed up your workflow once memorized. Instead of dragging icons or scrolling through menus, you can switch time frames, add drawing tools, or toggle indicators with a simple key press.
Some handy shortcuts include:
Alt + 1 to Alt + 9: Switch chart layouts
Ctrl + Z: Undo last action
Ctrl + Y: Redo
Alt + T: Add trendline
Regular use of shortcuts turns routine tasks into quick flicks of the fingers, leaving more room to focus on market trends and strategy.
Getting familiar with these shortcuts—even practicing a bit each day—pays off with smoother, less distracting chart work.
Implementing these tips can turn TradingView from just another charting tool into a personal command center tailored to your trading style. Managing watchlists and portfolios effectively keeps you organized, while templates and shortcuts save precious seconds that add up big over multiple trades and sessions. For traders in Pakistan, where juggling multiple markets and limited internet uptime is common, these efficiencies aren’t a luxury—they're a necessity.
Every platform has its quirks and TradingView is no exception. Understanding common pitfalls helps traders avoid frustration and stay focused on what matters—making sound market decisions. This section takes a hard look at two main challenges: data delays and market coverage, plus typical technical glitches. Knowing these issues early on means you can tackle them head-on without losing precious trading time.
Understanding free vs paid data
TradingView offers free data streams for most markets, which is great for starters or casual traders. But free data often comes with a lag—sometimes just a few seconds, sometimes longer—especially during busy market hours. For example, Pakistani traders tracking the Karachi Stock Exchange via TradingView may notice differing levels of delay depending on the feed.
Paid plans, such as TradingView Pro or Premium, come with real-time data (or close to it) covering many major exchanges worldwide. This difference is vital if you depend on precise timing for quick entry or exit. If you sense your charts are catching up a few seconds late, upgrading your data access can make a tangible impact on your accuracy.
Tip: Check your plan’s data feed and compare it against actual market movements on your broker’s platform to spot delays early.
Local exchange data limitations
Local stock exchanges, like PSX (Pakistan Stock Exchange), sometimes don’t provide full data coverage to platforms like TradingView due to licensing or technical restrictions. This means some of the detailed tick-by-tick data and depth of market information might be missing or outdated. Moreover, certain financial instruments traded locally might not appear on TradingView or only show basic data.
For active traders, these limitations require patience and a backup plan. Using TradingView alongside your local broker’s platform could fill in the gaps. Also, keeping an eye on TradingView’s updates around local data support can help you know when improvements happen.
Resolving loading errors
Loading errors on TradingView can pop up unexpectedly—maybe the chart won’t refresh, indicators fail to load, or overall sluggishness appears. These issues usually stem from internet hiccups, overloaded browser cache, or conflicts with browser extensions.
Here’s a quick checklist to resolve these problems:
Refresh the page or restart your browser.
Clear your browser’s cache and cookies.
Disable any ad blockers or extensions interfering with TradingView.
Try a different web browser or switch to the desktop/mobile app.
Restart your internet router if connectivity seems slow.
If these steps don’t fix the issue, it might be a temporary server problem on TradingView’s side; waiting a short period often helps.
Getting help from support
TradingView has extensive help resources, including tutorials, FAQs, and community forums. However, when you’re stuck with a tough problem—like persistent bugs or account issues—reaching out directly to their support team is best.
Use the Contact Support option within your TradingView account.
Be clear and detailed: mention your platform version, device, browser, and the exact issue with screenshots if possible.
TradeView’s customer service has a decent reputation for timely responses. Keeping copies of your communications can speed up follow-up if needed.
Dealing with these challenges wisely keeps your trading smooth and helps you get the most from TradingView’s powerful features, even when the unexpected hits.
Wrapping up, TradingView offers more than just slick charts and real-time data—it’s a toolkit built to make trading easier and more informed. For traders in Pakistan, where access to global markets can feel like a bit of an uphill battle, TradingView bridges that gap with its cloud-based setup and community-driven insights. Getting a grip on all its features can really change how you approach your trading, whether you’re just starting out or already deep in the game.
TradingView shines when it comes to accessibility. Since it’s cloud-based, nothing ties you down to a certain device—you can jump from your phone on the go to your desktop at home without missing a beat. Plus, the platform covers tons of markets, from U.S. stocks to cryptocurrencies, allowing Pakistani traders to scan across asset classes without needing multiple tools. This flexibility lets you tweak your charts and indicators according to what suits your style and strategy.
One of TradingView’s underrated gems is its active community. Traders and analysts around the world share their charts and ideas openly, which means you get to peek into others’ strategies and reasoning. This is especially helpful in Pakistan where local market info might not always be as transparent or easy to digest. By following skilled traders and engaging in discussions, you enhance your own decision-making toolkit and catch trends or setups you might have missed alone.
The platform is packed with resources to help you get better every day. Try exploring their tutorials or experimenting with backtesting trading ideas using historical data. Start simple—like setting up moving averages or RSI—and gradually add more tools. This hands-on approach turns confusing charts into clear signals over time. For a Pakistani trader, cultivating these skills means you're not just gambling but making smarter trades based on solid analysis.
It’s one thing to use TradingView, but quite another to weave it into your daily trading routine effectively. Create custom watchlists for your favorite tickers or sectors like Pakistan Stock Exchange (PSX), oil markets, or international currencies. Use alerts to keep tabs on price movements without sitting glued to your screen. Also, think about syncing TradingView with a brokerage account that supports integrations, streamlining the process from analysis to execution. This makes your strategy more agile and responsive, which is crucial in fast-moving markets.
TradingView’s greatest strength lies in how it adapts to your needs—whether that means learning, monitoring, or acting quickly. For traders in Pakistan and everywhere, it’s not just about tools but how you use them to stay ahead.
By focusing on these practical advantages and next steps, you’ll unlock more consistent results and greater confidence in your trading journey.
Explore TradingView.com for Pakistani traders 🇵🇰! Learn to set up accounts, use advanced charts 📊, and join a vibrant trading community for smarter decisions 🌐.

Explore TradingView's key features and tools 📊, connect with traders, and master technical analysis for smarter investing in Pakistan’s markets 🇵🇰.
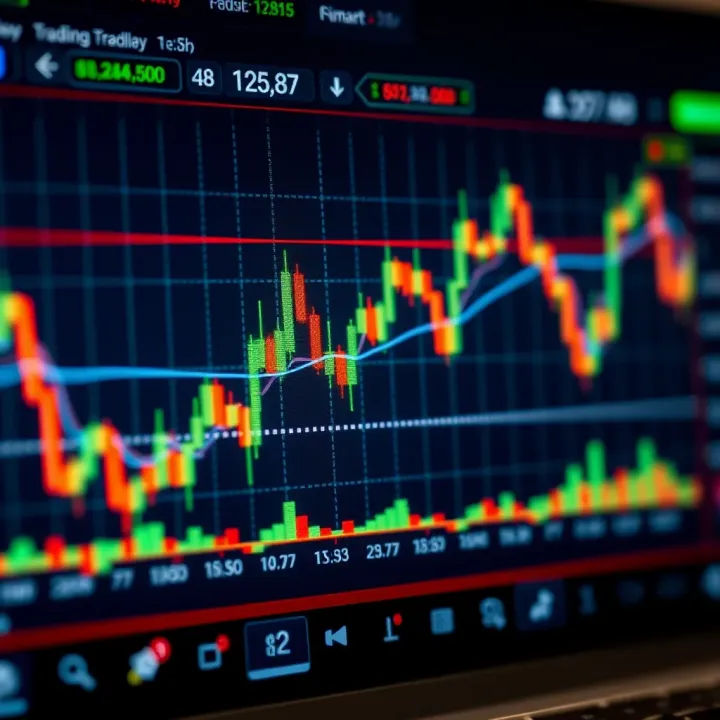
Discover how to master TradingView's advanced charts, tools & community features, tailored for traders in Pakistan to boost your trading game 📈🇵🇰.
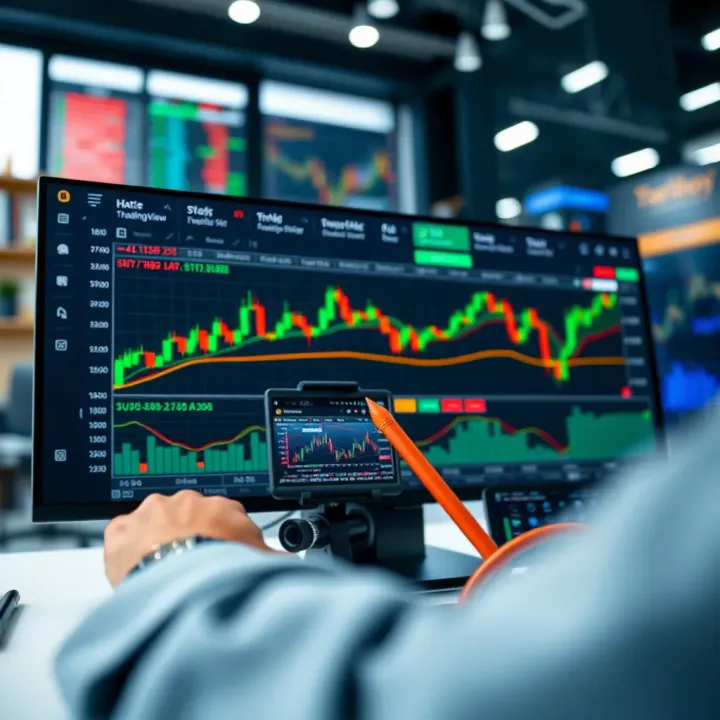
🔍 Explore TradingView's powerful tools and social features tailored for Pakistani traders. Learn setup, analysis, idea sharing, and mobile tips! 📈📱
Based on 14 reviews